Sample 24915: Label data points with the Annotate CBOX and CBORDER variables
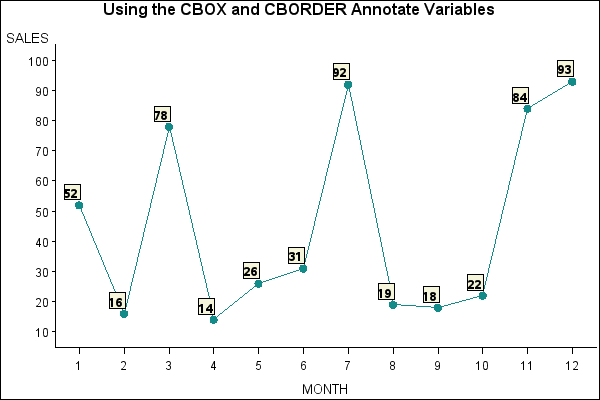
This sample program uses PROC GPLOT with the Annotate CBOX and CBORDER variables to blank out an area so that text and symbols can be more visible on a graph.
These sample files and code examples are provided by SAS Institute
Inc. "as is" without warranty of any kind, either express or implied, including
but not limited to the implied warranties of merchantability and fitness for a
particular purpose. Recipients acknowledge and agree that SAS Institute shall
not be liable for any damages whatsoever arising out of their use of this material.
In addition, SAS Institute will provide no support for the materials contained herein.
This sample program uses PROC GPLOT with the Annotate CBOX and CBORDER variables to blank out an area so that text and symbols can be more visible on a graph.
The graphics output in the Results tab was produced using SAS® 9.2. Submitting the sample code with releases of SAS prior to SAS 9.2 might produce different results.
 /* Set the graphics environment */
goptions reset=all cback=white border htitle=12pt;

 /* Define a data set used for plotting */
data a;
   input MONTH SALES;
   datalines;
1 52
2 16
3 78
4 14
5 26
6 31
7 92
8 19
9 18
10 22
11 84
12 93
;
run;

 /* Create the annotate data set */
data anno;
  /* Set the length of variables */
   length function text color $8;

  /* Use the data coordinate system; position above and right aligned. */
  /* Apply annotation after procedure output.                          */
   retain xsys '2' ysys '2' position '1'  when 'a';
   set a;

  /* Label the data point */
   function='label';
   x=month; y=sales;
   text=left(put(sales,2.));
   style="'Albany AMT/bold'";
   size=1.3;

  /* Specify a beige box with a black outline */
   cbox='beige';
   cborder='black';
   color='black';
run;

 /* Define the symbol to be used */
symbol1 interpol=join value=dot color=vibg height=1.3;

title1 'Using the CBOX and CBORDER Annotate Variables';

 /* Define the axis statement */
axis1 offset=(4pct,4pct) minor=none;

 /* Plot the data using annotate to label the points */
proc gplot data=a;
   plot SALES*MONTH / anno=anno haxis=axis1 vaxis=axis1 noframe;
run;
quit;
These sample files and code examples are provided by SAS Institute
Inc. "as is" without warranty of any kind, either express or implied, including
but not limited to the implied warranties of merchantability and fitness for a
particular purpose. Recipients acknowledge and agree that SAS Institute shall
not be liable for any damages whatsoever arising out of their use of this material.
In addition, SAS Institute will provide no support for the materials contained herein.
This sample program uses PROC GPLOT with the Annotate CBOX and CBORDER variables to blank out an area so that text and symbols can be more visible on a graph.
| Type: | Sample |
| Topic: | SAS Reference ==> Procedures ==> GPLOT
Query and Reporting ==> Creating Reports ==> Graphical ==> Graph Types ==> Plots ==> Line
Query and Reporting ==> Creating Reports ==> Graphical ==> Graph Elements ==> Annotation
|
| Date Modified: | 2005-08-31 03:03:14 |
| Date Created: | 2004-11-11 11:07:59 |
Operating System and Release Information
| SAS System | SAS/GRAPH | z/OS | 9.1 TS1M0 | |
| Microsoft® Windows® for 64-Bit Itanium-based Systems | 9.1 TS1M0 | |
| Microsoft Windows Server 2003 Datacenter 64-bit Edition | 9.1 TS1M0 | |
| Microsoft Windows Server 2003 Enterprise 64-bit Edition | 9.1 TS1M0 | |
| Microsoft Windows 2000 Advanced Server | 9.1 TS1M0 | |
| Microsoft Windows 2000 Datacenter Server | 9.1 TS1M0 | |
| Microsoft Windows 2000 Server | 9.1 TS1M0 | |
| Microsoft Windows 2000 Professional | 9.1 TS1M0 | |
| Microsoft Windows NT Workstation | 9.1 TS1M0 | |
| Microsoft Windows Server 2003 Datacenter Edition | 9.1 TS1M0 | |
| Microsoft Windows Server 2003 Enterprise Edition | 9.1 TS1M0 | |
| Microsoft Windows Server 2003 Standard Edition | 9.1 TS1M0 | |
| Microsoft Windows XP Professional | 9.1 TS1M0 | |
| 64-bit Enabled AIX | 9.1 TS1M0 | |
| 64-bit Enabled HP-UX | 9.1 TS1M0 | |
| 64-bit Enabled Solaris | 9.1 TS1M0 | |
| HP-UX IPF | 9.1 TS1M0 | |
| Linux | 9.1 TS1M0 | |
| OpenVMS Alpha | 9.1 TS1M0 | |
| Tru64 UNIX | 9.1 TS1M0 | |


