Sample 24914: Create candlestick plots
 |  |  |  |  |
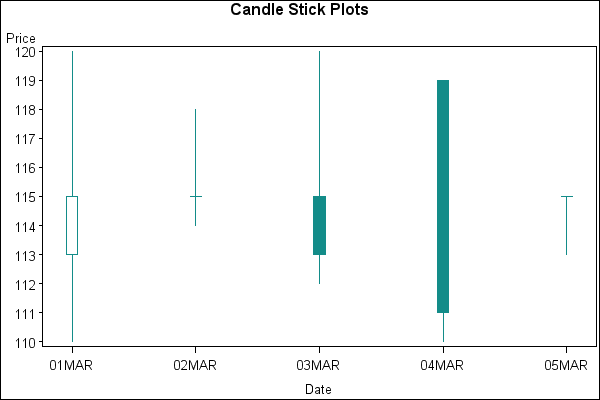
This example uses PROC GPLOT with the Annotate facility to generate candlestick plots.
These sample files and code examples are provided by SAS Institute Inc. "as is" without warranty of any kind, either express or implied, including but not limited to the implied warranties of merchantability and fitness for a particular purpose. Recipients acknowledge and agree that SAS Institute shall not be liable for any damages whatsoever arising out of their use of this material. In addition, SAS Institute will provide no support for the materials contained herein.
This example uses PROC GPLOT with the Annotate facility to generate candlestick plots.
The graphics output in the Results tab was produced using SAS® 9.2. Submitting the sample code with releases of SAS prior to SAS 9.2 might produce different results.
 /* Set the graphics environment */
goptions reset=all cback=white border htitle=12pt htext=10pt;

data stocks;
   input Date date7. High Low Close Open;
   datalines;
01mar99 120 110 115 113
02mar99 118 114 115 115
03mar99 120 112 113 115
04mar99 119 110 111 119
05mar99 115 113 115 115
;
run;

 /* Create the Annotate data set */
data candles;
   length color function style $8;
   retain xsys ysys '2' color 'vibg' size 1;

   set stocks;

   if close > open then style='empty';
   else style ='solid';

   /* Draw the open/close box */
   function='move';     xsys='2'; ysys='2'; x=date; y=close; output;
   function='poly';     xsys='7'; ysys='2'; x=+1;   y=close; output;
   function='polycont';                             y=open;  output;
   function='polycont';                     x=-1;   y=open;  output;
   function='polycont';                             y=close; output;
   function='polycont';                     x=+.5;  y=close; output;

   /* Draw high to close and low to open */
   if close > open then do;
      function='move'; xsys='2'; ysys='2'; x=date;   y=close; output;
      function='draw'; xsys='2'; ysys='2'; x=date;   y=high;  output;

      function='move'; xsys='2'; ysys='2'; x=date;   y=open;  output;
      function='draw'; xsys='2'; ysys='2'; x=date;   y=low;   output;
   end;

   /* Draw high to open and low to close */
   if close le open then do;
      function='move'; xsys='2'; ysys='2'; x=date;   y=open;  output;
      function='draw'; xsys='2'; ysys='2'; x=date;   y=high;  output;

      function='move'; xsys='2'; ysys='2'; x=date;   y=close; output;
      function='draw'; xsys='2'; ysys='2'; x=date;   y=low;   output;
   end;
run;

symbol1 interpol=none value=none repeat=2;

axis1 minor=none offset=(5,5)pct;
axis2 label=('Price') minor=none;

title1 'Candle Stick Plots';

 /* PROC GPLOT is used as a 'holding' area for the annotate. Plus, GPLOT */
 /* generates the axes.  An overlay plot is used so that the vertical    */
 /* axis has the complete range of the data, ie., high to low.           */
proc gplot data=stocks;
  plot high*date low*date / overlay haxis=axis1 vaxis=axis2
                            anno=candles;
  format date date5.;
run;
quit;
These sample files and code examples are provided by SAS Institute Inc. "as is" without warranty of any kind, either express or implied, including but not limited to the implied warranties of merchantability and fitness for a particular purpose. Recipients acknowledge and agree that SAS Institute shall not be liable for any damages whatsoever arising out of their use of this material. In addition, SAS Institute will provide no support for the materials contained herein.
This example uses PROC GPLOT with the Annotate facility to generate candlestick plots.
| Type: | Sample |
| Topic: | SAS Reference ==> Procedures ==> GPLOT Query and Reporting ==> Creating Reports ==> Graphical ==> Graph Elements ==> Annotation Query and Reporting ==> Creating Reports ==> Graphical ==> Graph Types ==> Plots ==> Other Plots |
| Date Modified: | 2005-08-31 03:03:13 |
| Date Created: | 2004-11-11 11:07:59 |
Operating System and Release Information
| Product Family | Product | Host | SAS Release | |
| Starting | Ending | |||
| SAS System | SAS/GRAPH | All | n/a | n/a |