Sample 24913: Maintain symbols across BY values with PROC GPLOT
 |  |  |  |  |
The sample code on the Full Code tab uses macro variables with PROC GPLOT to dynamically create SYMBOL statements that will maintain symbols across BY values. In the sample code, the BY statement is replaced with a WHERE statement and the GPLOT step is placed inside of a macro DO loop.
The sample code actually produces a total of three graphs. However, the Results tab displays only the first graph that the code creates.
These sample files and code examples are provided by SAS Institute Inc. "as is" without warranty of any kind, either express or implied, including but not limited to the implied warranties of merchantability and fitness for a particular purpose. Recipients acknowledge and agree that SAS Institute shall not be liable for any damages whatsoever arising out of their use of this material. In addition, SAS Institute will provide no support for the materials contained herein.
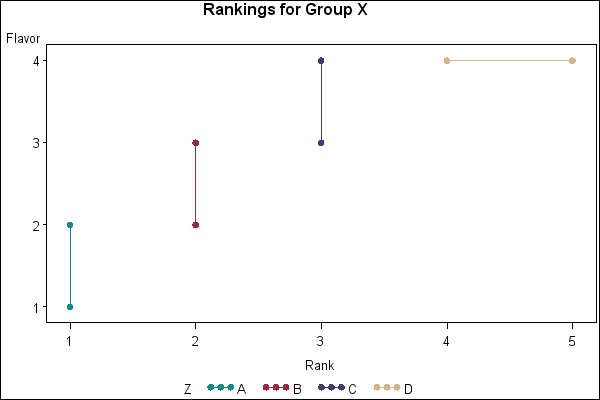
This sample code uses macro variables with PROC GPLOT to dynamically create SYMBOL statements that will maintain symbols across BY values. In the sample code, the BY statement is replaced with a WHERE statement and the GPLOT step is placed inside of a macro DO loop.
While the sample code actually produces a total of three graphs, the Results tab displays only the first graph that the code creates.
The graphics output on the Results tab was produced using SAS® 9.2. Submitting the sample code with releases of SAS prior to SAS 9.2 might produce different results.
 /* Set the graphics environment */
goptions reset=all cback=white border htitle=12pt htext=10pt;

 /* Turn on macro debugging options	*/
options symbolgen mlogic mprint;

 /* Create the input data set ICECREAM */
data icecream;
   input Flavor Rank Z $ GRP $;
   datalines;
1 1 A X
2 1 A X
2 2 B X
3 2 B X
3 3 C X
4 3 C X
4 4 D X
4 5 D X
1 1 A Y
2 1 A Y
3 3 C Y
4 3 C Y
2 2 B Z
3 2 B Z
4 4 D Z
4 5 D Z
;
run;

proc sort data=icecream;
   by grp z;
run;

 /* Create the data set NEW, which contains macro  */
 /* variables that eventually resolve to form      */
 /* SYMBOL statements that define the symbol       */
 /* characteristics, including the plotting symbol */
 /* and color, and the JOIN interpolation.         */
data new;
   set icecream end=eof;
   by grp z;

   if first.grp then do;
      bycount=0;
      total+1;
   end;
   if first.z then do;
      bycount+1;

      call symput('grp'||left(total),grp);

      if z='A' then do;
         call symput('pat'||trim(left(total))||trim(left(bycount)),
                     'symbol'||trim(left(total))||trim(left(bycount))
                     || ' '|| 'color=vibg'|| ' '||'value=dot'||' '|| 'interpol=join'|| ' '||';');
      end;

      if z='B' then do;
         call symput('pat'||trim(left(total))||trim(left(bycount)),
                     'symbol'||trim(left(total))||trim(left(bycount))
                     || ' '|| 'color=depk'|| ' '||'value=dot'||' '|| 'interpol=join'|| ' '||';');
      end;

      if z='C' then do;
         call symput('pat'||trim(left(total))||trim(left(bycount)),
                     'symbol'||trim(left(total))||trim(left(bycount))
                     || ' '|| 'color=mob'|| ' '||'value=dot'||' '|| 'interpol=join'|| ' '||';');
      end;

      if z='D' then do;
         call symput('pat'||trim(left(total))||trim(left(bycount)),
                     'symbol'||trim(left(total))||trim(left(bycount))
                     || ' '|| 'color=brown'|| ' '||'value=dot'||' '|| 'interpol=join'|| ' '||';');
      end;
   end;
   if last.grp then call symput('totnby'||trim(left(total)),bycount);

   if eof then call symput('total',total);
run;

 /* Create a macro to generate all the */
 /* necessary symbol statements        */
%macro symbol;
   %do j=1 %to &&totnby&i;
      &&pat&i&j
   %end;
%mend symbol;

 /* Create the macro GPLOT that will produce the graphs */
%macro gplot;
  %do i=1 %to &total;

     goptions reset=symbol;
     %symbol

     axis1 minor=none offset=(4pct,4pct);

     title1 "Rankings for Group &&grp&i";

     proc gplot data=icecream;
        where grp="&&grp&i";
        plot flavor*rank=z / haxis=axis1 vaxis=axis1 name='g24913';
     run;
     quit;
  %end;
%mend gplot;

 /* Call the GPLOT macro */
%gplot
These sample files and code examples are provided by SAS Institute Inc. "as is" without warranty of any kind, either express or implied, including but not limited to the implied warranties of merchantability and fitness for a particular purpose. Recipients acknowledge and agree that SAS Institute shall not be liable for any damages whatsoever arising out of their use of this material. In addition, SAS Institute will provide no support for the materials contained herein.
This sample uses macro variables with PROC GPLOT to dynamically create SYMBOL statements that will maintain symbols across BY values.
| Type: | Sample |
| Topic: | SAS Reference ==> Procedures ==> GPLOT Query and Reporting ==> Creating Reports ==> Graphical ==> Graph Elements ==> Symbols/Interpolation |
| Date Modified: | 2005-08-31 03:03:12 |
| Date Created: | 2004-11-11 11:07:59 |
Operating System and Release Information
| Product Family | Product | Host | SAS Release | |
| Starting | Ending | |||
| SAS System | SAS/GRAPH | All | n/a | n/a |