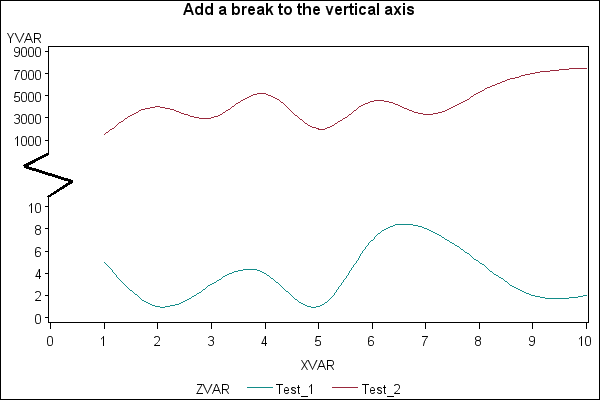
Sample 24909: Create a break on the vertical axis of a plot
This sample code uses PROC GPLOT with the Annotate facility to first cover part of the vertical axis and then redraw that section of the axis where the break occurs.
These sample files and code examples are provided by SAS Institute
Inc. "as is" without warranty of any kind, either express or implied, including
but not limited to the implied warranties of merchantability and fitness for a
particular purpose. Recipients acknowledge and agree that SAS Institute shall
not be liable for any damages whatsoever arising out of their use of this material.
In addition, SAS Institute will provide no support for the materials contained herein.
This sample code uses PROC GPLOT with the Annotate facility to first cover part of the vertical axis and then redraw that section of the axis where the break occurs.
The graphics output in the Results tab was produced using SAS® 9.2. Submitting the sample code with releases of SAS prior to SAS 9.2 might produce different results.
 /* Set the graphics environment */
goptions reset=all cback=white border htitle=12pt htext=10pt;

 /* Create the input data set A */
data a;
   input XVAR YVAR ZVAR $;
   datalines;
1 5 Test_1
2 1 Test_1
3 3 Test_1
4 4 Test_1
5 1 Test_1
6 7 Test_1
7 8 Test_1
8 5 Test_1
9 2 Test_1
10 2 Test_1
1 1500 Test_2
2 4000 Test_2
3 3000 Test_2
4 5200 Test_2
5 2000 Test_2
6 4500 Test_2
7 3300 Test_2
8 5300 Test_2
9 7000 Test_2
10 7500 Test_2
;
run;

 /* Create the annotate data set ANNO */
data anno;
   length function style color $8;
   retain xsys '5' ysys '2'  when 'a' style 'solid';

   /* Draw a solid white box to cover the area on */
   /* the vertical axis where the break occurs.   */
   function='move'; x=1; y=50; output;
   function='bar'; x=8;  y=500;  color='white'; output;

   /* Now draw the jagged line where the axis breaks. */
   color='black'; size=2;
   function='move'; xsys='1'; x=0;  ysys='2'; y=50; output;
   function='draw'; xsys='B'; ysys='B'; x=+4; y=+4; output;

   function='draw';                     x=-8; y=+4; output;
   function='draw'; xsys='1'; x=0;  ysys='2'; y=500; output;
run;

 /* Assign symbol definitions */
symbol1 i=smooth v=none c=vibg w=1;
symbol2 i=smooth v=none c=depk w=1;

 /* Add a title to the graph */
title1 'Add a break to the vertical axis';

 /* Create axis definitions */
axis1 order=(0 to 10 by 2, 100, 200, 1000 to 10000 by 2000)
      minor=none;
axis2 order=(0 to 10 by 1) minor=none;

 /* Create the graph using the ANNO= */
 /* option on the PLOT statement.    */
proc gplot data=a;
   plot yvar*xvar=zvar / vaxis=axis1 haxis=axis2 anno=anno;
run;
quit;
These sample files and code examples are provided by SAS Institute
Inc. "as is" without warranty of any kind, either express or implied, including
but not limited to the implied warranties of merchantability and fitness for a
particular purpose. Recipients acknowledge and agree that SAS Institute shall
not be liable for any damages whatsoever arising out of their use of this material.
In addition, SAS Institute will provide no support for the materials contained herein.
This sample code uses PROC GPLOT with the Annotate facility to first cover part of the vertical axis and then redraw that section of the axis where the break occurs.
| Type: | Sample |
| Topic: | SAS Reference ==> Procedures ==> GPLOT
Query and Reporting ==> Creating Reports ==> Graphical ==> Graph Elements ==> Annotation
|
| Date Modified: | 2007-10-15 07:53:27 |
| Date Created: | 2004-11-11 11:07:59 |
Operating System and Release Information
| SAS System | SAS/GRAPH | All | n/a | n/a |


