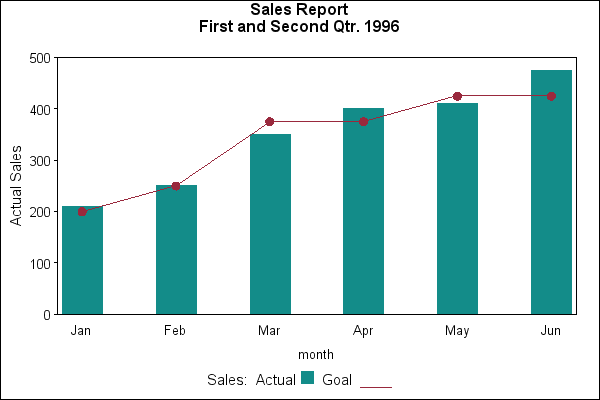
Sample 24908: Overlay a plot line on a vertical bar chart with PROC GPLOT
This example uses PROC GPLOT with the NEEDLE interpolation on a SYMBOL statement with the WIDTH= option to simulate a vertical bar chart.
If you have SAS 9, the GBARLINE procedure can also be used to produce this type of graph. Please see SAS Sample 24863.
These sample files and code examples are provided by SAS Institute
Inc. "as is" without warranty of any kind, either express or implied, including
but not limited to the implied warranties of merchantability and fitness for a
particular purpose. Recipients acknowledge and agree that SAS Institute shall
not be liable for any damages whatsoever arising out of their use of this material.
In addition, SAS Institute will provide no support for the materials contained herein.
This sample code uses PROC GPLOT with the NEEDLE interpolation on a SYMBOL statement with the WIDTH= option to simulate a vertical bar chart.
The graphics output in the Results tab was produced using SAS® 9.2. Submitting the sample code with releases of SAS prior to SAS 9.2 might produce different results.
 /* Set the graphics environment */
goptions reset=all cback=white border
         htitle=12pt htext=10pt;

 /* Create input data set, A */
data a;
   input month date7. goal actual;
   datalines;
01jan96 200 210
01feb96 250 250
01mar96 375 350
01apr96 375 400
01may96 425 410
01jun96 425 475
;
run;

 /* Create axis definitions */
axis1 order=('01jan96'd to '01jun96'd by month)
      offset=(5) major=none;
axis2 order=(0 to 500 by 100) offset=(0,0)
      minor=none label=(a=90 h=11pt 'Actual Sales');

 /* Create symbol definitions */
symbol1 c=vibg i=needle v=none w=40;
symbol2 c=depk i=join   v=dot h=1.5;

/* Add titles and footnotes */
footnote1 h=11pt c=black 'Sales:  Actual ' c=vibg f=marker 'U'
          c=black f='Albany AMT' '  Goal  ' c=depk   '____';
footnote2 h=1 '  ';
footnote3 angle=90 '  ';
title1 'Sales Report';
title2 h=12pt 'First and Second Qtr. 1996';

/* Produce the plot */
proc gplot data=a;
   format month monname3.;
   plot actual*month goal*month / overlay haxis=axis1 vaxis=axis2;
run;
quit;
These sample files and code examples are provided by SAS Institute
Inc. "as is" without warranty of any kind, either express or implied, including
but not limited to the implied warranties of merchantability and fitness for a
particular purpose. Recipients acknowledge and agree that SAS Institute shall
not be liable for any damages whatsoever arising out of their use of this material.
In addition, SAS Institute will provide no support for the materials contained herein.
This example uses PROC GPLOT with the NEEDLE interpolation on a SYMBOL statement with the WIDTH= option to simulate a vertical bar chart.
| Type: | Sample |
| Topic: | SAS Reference ==> Procedures ==> GPLOT
Query and Reporting ==> Creating Reports ==> Graphical ==> Graph Types ==> Plots ==> Other Plots
|
| Date Modified: | 2008-01-16 06:31:05 |
| Date Created: | 2004-11-11 11:07:58 |
Operating System and Release Information
| SAS System | SAS/GRAPH | All | n/a | n/a |


