Sample 24904: Thicken the map outline with PROC GMAP
 |  |  |  |  |
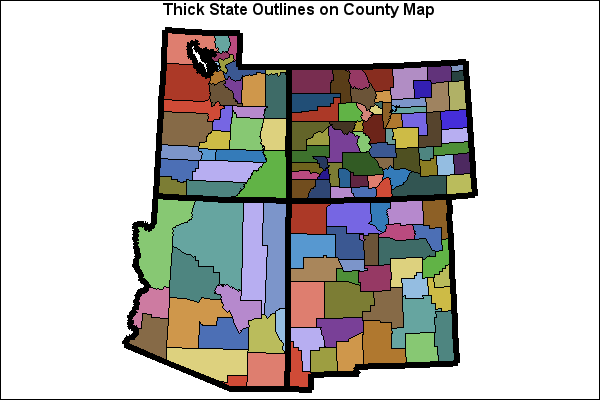
This sample program uses PROC GMAP to produce a county map of Arizona, Colorado, New Mexico, and Utah with thick state outlines.
These sample files and code examples are provided by SAS Institute Inc. "as is" without warranty of any kind, either express or implied, including but not limited to the implied warranties of merchantability and fitness for a particular purpose. Recipients acknowledge and agree that SAS Institute shall not be liable for any damages whatsoever arising out of their use of this material. In addition, SAS Institute will provide no support for the materials contained herein.
This sample program uses PROC GMAP to produce a county map of Arizona, Colorado, New Mexico, and Utah with thick state outlines.
The graphics output in the Results tab was produced using SAS® 9.2. Submitting the sample code with releases of SAS prior to SAS 9.2 might produce different results.
/*******************************************************************/
/* This sample program produces a map of Arizona, Colorado,        */
/* New Mexico, and Utah with thick state outline.                  */
/* You can change the width of the line by changing the value of   */
/* the SIZE variable in the ANNO annotate data set.                */
/*                                                                 */
/* Since we are using an unprojected county map, we need to use    */
/* the GPROJECT procedure to project the map data.  Subset the     */
/* specified states during the projection.                         */
/* If you include Alaska, you might want to use the GNOMON         */
/* projection with the POLELONG option to better center the map.   */
/*******************************************************************/

 /* Set the graphics environment */
goptions reset=all cback=white border htitle=12pt htext=10pt;

 /* Create a projected map data set named MAP */
proc gproject data=maps.county out=map;
  id state county;

  /* Use the state FIPS codes to subset the desired states */
  where state in (4 8 35 49);
run;
quit;

 /* Since we want to thicken the outline of the state boundaries,   */
 /* we need to get the coordinates for the state outlines.  Using   */
 /* the GREMOVE procedure, we can remove the county boundaries to   */
 /* create a data set of only the state boundaries.                 */

 /* Create a data set named STATES that contains the state boundaries */
proc gremove data=map out=states;

  /* STATE is the new identification variable */
  by state;

  /* STATE and COUNTY were the original identification variables */
  id state county;
run;
quit;

 /* Increment the SEGMENT variable value for all lake coordinates */
 /* indicated by missing X and Y values.                          */
data states;
  set states;
  by state;
  retain flag num 0;

  /* Reset the flag value for each state */
  if first.state then do;
     flag=0;
     num=0;
  end;

  /* Set the flag value when x and y are missing */
  if x=. and y=. then do;
    flag=1;
    num + 1;
    delete;
  end;

  /* Increment the segment value */
  if flag=1 then segment + num;
  drop flag num;
run;

/* Use the Annotate Facility to draw the outlines for the states   */
/*                                                                 */
/* The data coordinate system of '2' is used for XSYS and YSYS to  */
/* place the annotation on the map at the correct location. The    */
/* WHEN variable is set to 'A' to place the annotation after the   */
/* procedure output has been drawn.  The color for the outlines is */
/* set to black.  The size of the outline is set to 5.  The color  */
/* and size of the outlines can be changed by changing the values  */
/* in the COLOR and SIZE variables, respectively.                  */

 /* Create an annotate data set named ANNO for the state outlines */
data anno;
  length function color $8;
  retain xsys ysys '2' when 'a' color 'black' size 5;
  drop xsave ysave;

  set states;
  by state segment;

  /* Move to the first coordinate */
  if first.segment then function='poly';

  /* Draw to each successive coordinate */
  else function='polycont';
  output;
run;

title1 'Thick State Outlines on County Map';

 /* Generate a county map with thick state boundaries */
proc gmap data=map map=map;
  id state county;
  choro county / anno=anno discrete nolegend;
run;
quit;
These sample files and code examples are provided by SAS Institute Inc. "as is" without warranty of any kind, either express or implied, including but not limited to the implied warranties of merchantability and fitness for a particular purpose. Recipients acknowledge and agree that SAS Institute shall not be liable for any damages whatsoever arising out of their use of this material. In addition, SAS Institute will provide no support for the materials contained herein.
This sample program uses PROC GMAP to produce a county map of Arizona, Colorado, New Mexico, and Utah with thick state outlines.
| Type: | Sample |
| Topic: | SAS Reference ==> Procedures ==> GMAP Query and Reporting ==> Creating Reports ==> Graphical ==> Graph Elements ==> Annotation |
| Date Modified: | 2005-08-31 03:03:08 |
| Date Created: | 2004-11-11 11:07:58 |
Operating System and Release Information
| Product Family | Product | Host | SAS Release | |
| Starting | Ending | |||
| SAS System | SAS/GRAPH | All | n/a | n/a |