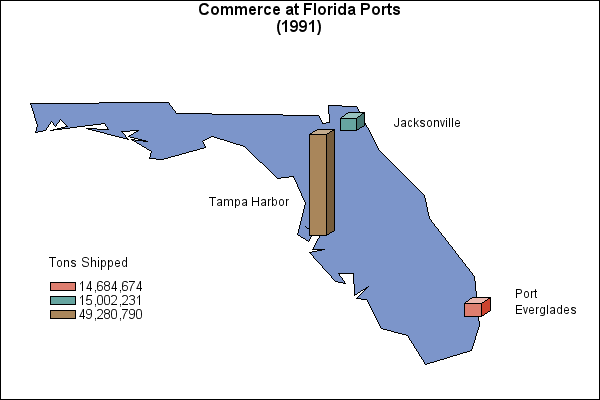
Sample 24895: Display 3D bars at cities on a state map with PROC GMAP
The sample code on the Full Code tab creates a "state" or map area for each of the three Florida cities by subsetting their coordinates from MAPS.USCITY and assigning each city a unique identification value. These three new map areas are then added to a map data set of Florida. The response data set also uses the new identification values so that the map of Florida can display data at the city locations.
These sample files and code examples are provided by SAS Institute
Inc. "as is" without warranty of any kind, either express or implied, including
but not limited to the implied warranties of merchantability and fitness for a
particular purpose. Recipients acknowledge and agree that SAS Institute shall
not be liable for any damages whatsoever arising out of their use of this material.
In addition, SAS Institute will provide no support for the materials contained herein.
This PROC GMAP sample program creates a "state" or map area for each of the three Florida cities by subsetting their coordinates from MAPS.USCITY and assigning each city a unique identification value. These three new map areas are then added to a map data set of Florida. The response data set also uses the new identification values so that the map of Florida can display data at the city locations.
The graphics output on the Results tab was produced using SAS® 9.2. Submitting the sample code with releases of SAS prior to SAS 9.2 might produce different results.
 /* Set the graphics environment */
goptions reset=all cback=white border htitle=12pt htext=10pt;

 /* Create the data set, CTYCOORD. CTYCOORD is a map data set of three */
 /* Florida cities.  It is created by subsetting MAPS.USCITY and       */
 /* assigning a unique value for each city to the variable STATE.      */
data ctycoord(drop=cityfips);
   set maps.uscity(where=(state=12 and cityfips in (1050,1510,2950))
                   keep=city cityfips state x y);
   state=state+cityfips;
   output;

   /* Define a polygon for the GMAP procedure, add a small     */
   /* number to the X and Y to create a small triangle at each */
   /* of the port locations.                                   */
   x=x+.0000001; output;
   y=y+.0000001; output;
run;

 /* Create the map data set, FLMAP. FLMAP contains map coordinates and    */
 /* identification values for both Florida and the three cities.  The SET */
 /* statement uses the WHERE= data set options to subset map information  */
 /* for Florida (FIPS code 12) and then appends the observations in the   */
 /* CTYCOORD data set to create FLMAP.                                    */
data flmap;
   set maps.us(where=(state=12) drop=segment) ctycoord;
run;

 /* Create the response data, SHIPPING. SHIPPING contains the number of tons */
 /* shipped from the three Florida ports. The variable STATE is assigned the */
 /* same unique identification value as in the CTYCOORD data set.            */
data shipping(drop=cityfips);
   input state cityfips portname & $15. tonnage;
   state=state+cityfips;
   datalines;
12  2950  Tampa Harbor     49280790
12  1510  Jacksonville     15002231
12  1050  Port Everglades  14684674
12     0  .                .
;

 /* Create the Annotate data set, LABEL. LABEL adds the names of the cities  */
 /* to the map. Because block maps cannot use data coordinate systems, the   */
 /* labels are positioned using coordinate system 3 (absolute percent of the */
 /* graphics output area) and explicitly assigning coordinate values to the  */
 /* X and Y variables.                                                       */
data label;
   length function $ 8 text $ 20;
   retain function 'label' xsys ysys hsys '3' size 3;

   position='4';         /* POSITION='4' right aligns the label */
   x=77; y=70; text='Jacksonville'; output;

   position='6';         /* POSITION='6' left aligns the labels */
   x=35; y=50; text='Tampa Harbor'; output;
   x=86; y=27; text='Port'; output;
   x=86; y=23; text='Everglades'; output;
run;

 /* Add titles and footnotes. The null FOOTNOTE1 statement adds space for the */
 /* city labels to the right of the map. FOOTNOTE2 adds space to the left of  */
 /* the map.                                                                  */
title1 'Commerce at Florida Ports';
title2 h=12pt '(1991)';
footnote1 angle=90 height=10 ' ';
footnote2 angle=-90 height=2 ' ';

 /* Define patterns for the map. PATTERN1 specifies a color for the map areas. */
 /* The remaining PATTERN statements specify colors for the blocks.            */
pattern1 value=msolid color=cx7c95ca;
pattern2 value=solid  color=cxde7e6f;
pattern3 value=solid  color=cx66a5a0;
pattern4 value=solid  color=cxa9865b;

 /* Modify the legend. MODE=SHARE allows the legend to be drawn with the map in */
 /* the procedure output area.                                                  */
legend1 /*shape=bar(6,3)*/ position=(left bottom) offset=(5,8)
        mode=share across=1 label=(position=top 'Tons Shipped');

 /* Produce the block map of Florida. Both the map data set, FLMAP, and the response  */
 /* data set, SHIPPING, include the same ID variable, STATE.  The DISCRETE option in  */
 /* the BLOCK statement causes each value of TONNAGE to be a separate response level. */
 /* The BLOCK statement includes the annotation defined in the LABEL data set.        */
proc gmap data=shipping map=flmap;
   format tonnage comma12.;
   id state;
   block tonnage / discrete blocksize=4 xview=.7 legend=legend1
                   annotate=label;
run;
quit;
These sample files and code examples are provided by SAS Institute
Inc. "as is" without warranty of any kind, either express or implied, including
but not limited to the implied warranties of merchantability and fitness for a
particular purpose. Recipients acknowledge and agree that SAS Institute shall
not be liable for any damages whatsoever arising out of their use of this material.
In addition, SAS Institute will provide no support for the materials contained herein.
By default, the GMAP procedure draws only one block per state. To display blocks at city locations, create an artificial state for each city and add the new states to a map data set.
| Type: | Sample |
| Topic: | SAS Reference ==> Procedures ==> GMAP
Query and Reporting ==> Creating Reports ==> Graphical ==> Graph Types ==> Maps ==> Other Maps
Query and Reporting ==> Creating Reports ==> Graphical ==> Graph Elements ==> Annotation
|
| Date Modified: | 2005-08-24 16:06:30 |
| Date Created: | 2004-11-11 11:07:56 |
Operating System and Release Information
| SAS System | SAS/GRAPH | All | n/a | n/a |


