Sample 24894: Draw data-dependent circles on a map with PROC GMAP
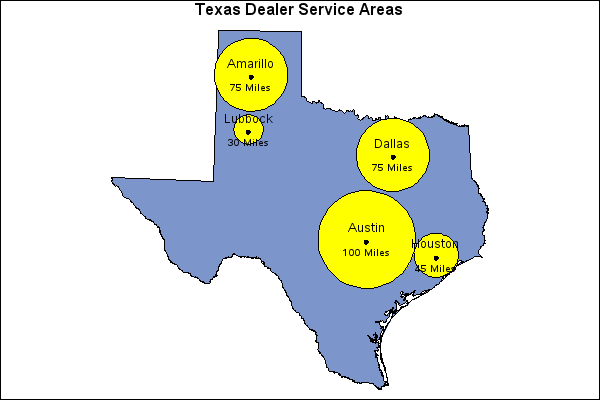
This sample uses PROC GMAP to generate a map of Texas containing points at specified dealer locations. A circle is drawn around each point to represent its service area, in miles.
These sample files and code examples are provided by SAS Institute
Inc. "as is" without warranty of any kind, either express or implied, including
but not limited to the implied warranties of merchantability and fitness for a
particular purpose. Recipients acknowledge and agree that SAS Institute shall
not be liable for any damages whatsoever arising out of their use of this material.
In addition, SAS Institute will provide no support for the materials contained herein.
This sample code uses PROC GMAP to generate a map of Texas containing points at specified dealer locations. A circle is drawn around each point to represent its service area, in miles.
The graphics output in the Results tab was produced using SAS® 9.2. Submitting
the sample code with releases of SAS prior to SAS 9.2 might produce different results.
 /* Set the graphics environment */
goptions reset=all cback=white border htitle=12pt htext=10pt;

 /* Create a data set containing the dealer information */
data dealers;

  /* SRVAREA is the radius, in miles, of the dealer's service area to be drawn  */
  /* LONG and LAT are the longitude and latitude values for the dealer location */
  /* CITY is the name of the city where the dealer is located.                  */
  input srvarea long lat city $25.;

  /* Convert degrees to radians */
  x=atan(1)/45 * long;
  y=atan(1)/45 * lat;

  datalines;
30 101.875374 33.57585 Lubbock
75 96.765249 32.794151 Dallas
45 95.386728 29.7687 Houston
75 101.818682 35.20255 Amarillo
100 97.750522 30.30588 Austin
;
run;

 /* Create an annotate data set to place a point and label */
 /* at the dealer locations and draw a service area circle */
data anno;

  /* Get the dealer locations from the dealers data set */
  set dealers;
  retain xsys ysys '2' flag 1 when 'a';
  length text $25 color function $ 8 style $ 25;
  drop xold yold;

  /* Retain the original coordinates for the placing labels */
  xold=x;
  yold=y;

  d2r=3.1415926/180;

  /* Radius of the earth in miles */
  r=3958.739565;

  /* Point for the circle to be drawn around */
  xcen=long;
  ycen=lat;

  /* Calculate the points to draw a circle */
  do degree=0 to 360 by 5;

     /* Begin a new circle */
     if degree=0 then do;

	   /* The circles will be solid yellow */
       function='poly';
	   line=1;
	   style='msolid';
	   color='yellow';
     end;

	 /* Continue drawing the circle */
     else do;
       function='polycont';

	   /* Outline the circle with black */
	   color='black';
     end;

	 /* Calculate a point along the circle */
     y=arsin(cos(degree*d2r)*sin(srvarea/R)*cos(ycen*d2r)+
       cos(srvarea/R)*sin(ycen*d2r))/d2r;
     x=xcen+arsin(sin(degree*d2r)*sin(srvarea/R)/cos(y*d2r))/d2r;

	 /* Convert degrees to radians */
     x=atan(1)/45*x;
     y=atan(1)/45*y;
	 output;
  end;

  /* Use the original x and y values to place the labels */
  x=xold;
  y=yold;

  /* Create an observation to place a point at the dealer location */
  function='label';
  style='special';
  text='J';
  position='5';
  color='black';
  output;

  /* Create an observation to label the location of the dealer */
  style="'Albany AMT'";
  text=city;
  position='2';
  color='black';
  output;

  /* Create an observation to label the service area */
  text=trim(left(srvarea))||' Miles';
  size=1;
  position='8';
  output;

run;

 /* Combine the annotate data set with the map data set */
data combo;

  /* Subset the map data set for the state of Texas */
  set anno maps.states(where=(state=48));
run;

 /* Project the data */
proc gproject data=combo out=proj dupok;
  id state;
run;

 /* Create a new map data set and annotate data set */
 /* from the projected data                         */
data tx label;
  set proj;

  /* Annotate data set observation */
  if flag=1 then output label;

  /* Map data set observation */
  else output tx;
run;

pattern v=msolid c=cx7c95ca;

title1 'Texas Dealer Service Areas';

 /* Generate a map with dealer points and circles */
proc gmap data=tx map=tx anno=label;
  id state;
  choro state / coutline=black nolegend;
run;
quit;
These sample files and code examples are provided by SAS Institute
Inc. "as is" without warranty of any kind, either express or implied, including
but not limited to the implied warranties of merchantability and fitness for a
particular purpose. Recipients acknowledge and agree that SAS Institute shall
not be liable for any damages whatsoever arising out of their use of this material.
In addition, SAS Institute will provide no support for the materials contained herein.
This sample uses PROC GMAP to generate a map of Texas containing points at specified dealer locations. A circle is drawn around each point to represent its service area, in miles.
| Type: | Sample |
| Topic: | SAS Reference ==> Procedures ==> GMAP
Query and Reporting ==> Creating Reports ==> Graphical ==> Graph Elements ==> Annotation
|
| Date Modified: | 2005-09-22 03:03:08 |
| Date Created: | 2004-11-11 11:07:56 |
Operating System and Release Information
| SAS System | SAS/GRAPH | All | n/a | n/a |


