Sample 24885: Use PROC GCHART to label midpoint values longer than 32 characters
 |  |  |  |  |
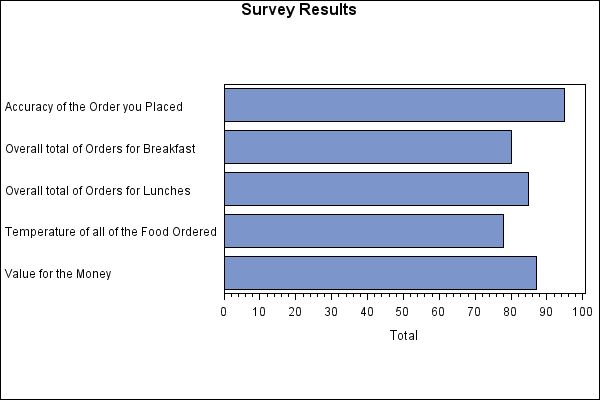
This sample uses macro code to pass long character strings to the VALUE= option on the AXIS statement with PROC GCHART.
These sample files and code examples are provided by SAS Institute Inc. "as is" without warranty of any kind, either express or implied, including but not limited to the implied warranties of merchantability and fitness for a particular purpose. Recipients acknowledge and agree that SAS Institute shall not be liable for any damages whatsoever arising out of their use of this material. In addition, SAS Institute will provide no support for the materials contained herein.
This sample uses macro code to pass long character strings to the VALUE= option on the AXIS statement with PROC GCHART.
The graphics output in the Results tab was produced using SAS® 9.2. Submitting the sample code with releases of SAS prior to SAS 9.2 might produce different results.
 /* Set the graphics environment */
goptions reset=all border cback=white htitle=12pt;

 /* Create the input data set A */
data a;
   input maxis1 $ 1-40 total;
   datalines;
Accuracy of the Order you Placed         95
Overall total of Orders for Breakfast    80
Overall total of Orders for Lunches      85
Temperature of all of the Food Ordered   78
Value for the Money                      87
;
run;

 /* Create macro variables MAXIS2 and TOTAL. The    */
 /* TOTAL macro variable contains the total number  */
 /* of observations in the data set. The END=option */
 /* on the SET statement creates the varible EOF    */
 /* that signals the end-of file.                   */

data _null_;
   set a end=eof;
   call symput('maxis2' || left(_n_),"'" || trim(maxis1) || "'");
   if eof then do;
      call symput('total',_n_);
   end;
run;

 /* The MCDOLOOP macro is used to pass the long character    */
 /* string to the VALUE= option in the AXIS statement in the */
 /* PROC GCHART step.                                        */
%macro mcdoloop;
   %do i=1 %to &total;
     &&maxis2&i
   %end;
%mend mcdoloop;

 /* Create axis characteristics.  The values of the macro        */
 /* variables generated by the %DO loop in MCDOLOOP macro change */
 /* for each observation.                                        */

axis1 value=(%mcdoloop) label=none;
axis2 label=('Total');

 /* Add a title to the graph */
title 'Survey Results';

 /* Produce the chart */
proc gchart data=a;
   hbar maxis1 / maxis=axis1 raxis=axis2 sumvar=total nostats;
run;
quit;
These sample files and code examples are provided by SAS Institute Inc. "as is" without warranty of any kind, either express or implied, including but not limited to the implied warranties of merchantability and fitness for a particular purpose. Recipients acknowledge and agree that SAS Institute shall not be liable for any damages whatsoever arising out of their use of this material. In addition, SAS Institute will provide no support for the materials contained herein.
This sample uses macro code to pass long character strings to the VALUE= option on the AXIS statement with PROC GCHART.
| Type: | Sample |
| Topic: | SAS Reference ==> Procedures ==> GCHART Query and Reporting ==> Creating Reports ==> Graphical ==> Graph Types ==> Charts ==> Bar |
| Date Modified: | 2005-08-24 16:06:29 |
| Date Created: | 2004-11-11 11:07:55 |
Operating System and Release Information
| Product Family | Product | Host | SAS Release | |
| Starting | Ending | |||
| SAS System | SAS/GRAPH | z/OS | 9.1 TS1M0 | |
| Microsoft® Windows® for 64-Bit Itanium-based Systems | 9.1 TS1M0 | |||
| Microsoft Windows Server 2003 Datacenter 64-bit Edition | 9.1 TS1M0 | |||
| Microsoft Windows Server 2003 Enterprise 64-bit Edition | 9.1 TS1M0 | |||
| Microsoft Windows 2000 Advanced Server | 9.1 TS1M0 | |||
| Microsoft Windows 2000 Datacenter Server | 9.1 TS1M0 | |||
| Microsoft Windows 2000 Server | 9.1 TS1M0 | |||
| Microsoft Windows 2000 Professional | 9.1 TS1M0 | |||
| Microsoft Windows NT Workstation | 9.1 TS1M0 | |||
| Microsoft Windows Server 2003 Datacenter Edition | 9.1 TS1M0 | |||
| Microsoft Windows Server 2003 Enterprise Edition | 9.1 TS1M0 | |||
| Microsoft Windows Server 2003 Standard Edition | 9.1 TS1M0 | |||
| Microsoft Windows XP Professional | 9.1 TS1M0 | |||
| 64-bit Enabled AIX | 9.1 TS1M0 | |||
| 64-bit Enabled HP-UX | 9.1 TS1M0 | |||
| 64-bit Enabled Solaris | 9.1 TS1M0 | |||
| HP-UX IPF | 9.1 TS1M0 | |||
| Linux | 9.1 TS1M0 | |||
| OpenVMS Alpha | 9.1 TS1M0 | |||
| Tru64 UNIX | 9.1 TS1M0 | |||