Sample 24884: Annotate +/- one standard deviation of the mean with PROC GCHART - Example 2
The sample code on the Full Code tab uses PROC GCHART with the Annotate facility to draw one standard deviation of the mean on a vertical bar chart. PROC MEANS is used to obtain the necessary statistics used by Annotate.
These sample files and code examples are provided by SAS Institute
Inc. "as is" without warranty of any kind, either express or implied, including
but not limited to the implied warranties of merchantability and fitness for a
particular purpose. Recipients acknowledge and agree that SAS Institute shall
not be liable for any damages whatsoever arising out of their use of this material.
In addition, SAS Institute will provide no support for the materials contained herein.
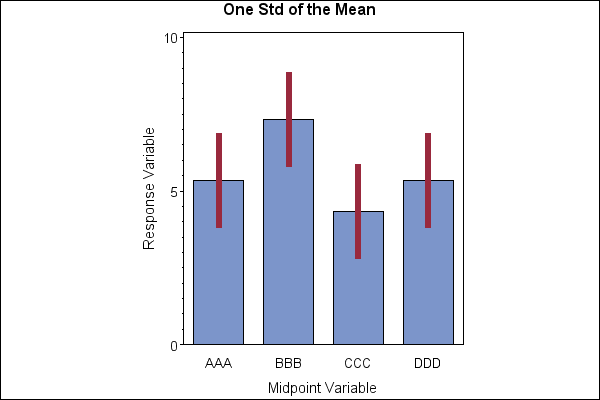
This sample uses PROC GCHART with the Annotate facility to draw one standard deviation of the mean on a vertical bar chart. PROC MEANS is used to obtain the necessary statistics used by Annotate.
The graphics output in the Results tab was produced using SAS® 9.2. Submitting
the sample code with releases of SAS prior to SAS 9.2 might produce different results.
 /* Set the graphics environment */
goptions reset=all cback=white border htitle=12pt htext=10pt;

data a;
   input Mid_Var $ Resp_Var;
   datalines;
AAA 5
AAA 4
AAA 7
BBB 7
BBB 6
BBB 9
CCC 4
CCC 3
CCC 6
DDD 5
DDD 4
DDD 7
;
run;

 /* Use PROC MEANS to calculate the statistics */
 /* needed when creating the Annotate data set */
proc means mean std data=a noprint;
   by mid_var;
   output out=b mean=mean std=std;
run;

 /* Create the Annotate data set */
data anno;
   length color function $8;
   retain xsys ysys '2' hsys '4' when 'a'
          color 'depk' size 5;
   set b;

   /* Draw the standard error bar.  You might need */
   /* to adjust the value of the SIZE variable.    */
   function='move';
   midpoint=mid_var; y=mean-std;
   output;
   function='draw';
   midpoint=mid_var; y=mean+std;
   output;
run;

axis1 order=(0 to 10 by 5)
      label=(angle=90 h=11pt 'Response Variable');
axis2 label=(h=11pt 'Midpoint Variable');

title1 'One Std of the Mean';

proc gchart data=a;
   vbar mid_var / anno=anno
                  raxis=axis1 maxis=axis2
                  type=mean sumvar=resp_var
	          width=10 space=4
		  coutline=black;
run;
quit;
These sample files and code examples are provided by SAS Institute
Inc. "as is" without warranty of any kind, either express or implied, including
but not limited to the implied warranties of merchantability and fitness for a
particular purpose. Recipients acknowledge and agree that SAS Institute shall
not be liable for any damages whatsoever arising out of their use of this material.
In addition, SAS Institute will provide no support for the materials contained herein.
This sample uses PROC GCHART with the Annotate facility to draw one standard deviation of the mean on a vertical bar chart. PROC MEANS is used to obtain the necessary statistics used by Annotate.
| Type: | Sample |
| Topic: | SAS Reference ==> Procedures ==> GCHART
Query and Reporting ==> Creating Reports ==> Graphical ==> Graph Elements ==> Annotation
Query and Reporting ==> Creating Reports ==> Graphical ==> Graph Types ==> Charts ==> Bar
|
| Date Modified: | 2005-08-24 16:06:28 |
| Date Created: | 2004-11-11 11:07:54 |
Operating System and Release Information
| SAS System | SAS/GRAPH | All | n/a | n/a |


