Sample 24879: Create a relative average chart
 |  |  |  |  |
The sample code on the Full Code tab illustrates how to generate a relative bar chart based upon the average response within each BY group. Upward bars indicate response values greater than the average and downward bars indicate response values less than the average.
These sample files and code examples are provided by SAS Institute Inc. "as is" without warranty of any kind, either express or implied, including but not limited to the implied warranties of merchantability and fitness for a particular purpose. Recipients acknowledge and agree that SAS Institute shall not be liable for any damages whatsoever arising out of their use of this material. In addition, SAS Institute will provide no support for the materials contained herein.
The sample code below illustrates how to generate a relative bar chart based upon the average response within each BY group. Upward bars indicate response values greater than the average and downward bars indicate response values less than the average.
/* Set the graphics environment */
goptions reset=all border cback=white htitle=12pt htext=10pt;

/* Specify macro debug options. */
options mprint macrogen symbolgen;

/* Create sample data set ONE. */
data one;
   do subscore=1 to 2;
      natavg=ranuni(0)*100;
      do student=1 to 5;
         do department=1 to 10;
            score=ranuni(0)*100;
            output;
         end;
      end;
   end;
run;

/* Sort data set ONE. */
proc sort data=one;
   by subscore department;
run;

/* Determine the mean values. */
proc means data=one noprint;
   var score;
   id natavg;
   by subscore department;
   output out=meandata mean=means;
run;

/* Create RELSCORE variable by subtracting national average from the means. */
data two;
   set meandata;
   relscore=means-natavg;
run;

/* Determine minimum and maximum RELSCORE values. */
proc means data=two min max noprint;
   var relscore;
   id natavg;
   by subscore;
   output out=range min=minscore max=maxscore;
run;

/* Create macro variables that resolve to values of SUBSCORE, */
/* NATAVG, start and end score values for the response axis,  */
/* and the total number of SUBSCORE values. */
data _null_;
   set range end=eof;
   by subscore;
   if first.subscore then count+1;
   call symput('sub'||left(count),trim(left(subscore)));
   call symput('nat'||left(count),trim(left(natavg)));
   newmin=round(minscore-10,10);
   call symput('start'||left(count),trim(left(put(newmin,5.0))));
   newmax=round(maxscore+10,10);
   call symput('finish'||left(count),trim(left(put(newmax,5.0))));
   if eof then call symput('total',left(count));
run;

/* Define the CHART macro. */
%macro chart;
   %do i=1 %to &total;

      /* Define the options for the vertical response axis. */
      axis1 order=(&&start&i to &&finish&i by 10)
            label=(angle=90 'Score');

      /* Define the options for the horizontal midpoint axis. */
      axis2 label=('Department') length=75pct;

      /* Define the title. */
      title1 'Relative Average Chart';

      /* Generate the chart */
      proc gchart data=two;
         where subscore=&&sub&i;
         vbar department / discrete sumvar=relscore
                           raxis=axis1 maxis=axis2
                           patternid=midpoint width=8;
         format relscore 5.0;
      run;
      quit;
   %end;
%mend chart;

/* Invoke the %CHART macro to create the graphs. */
%chart;
These sample files and code examples are provided by SAS Institute Inc. "as is" without warranty of any kind, either express or implied, including but not limited to the implied warranties of merchantability and fitness for a particular purpose. Recipients acknowledge and agree that SAS Institute shall not be liable for any damages whatsoever arising out of their use of this material. In addition, SAS Institute will provide no support for the materials contained herein.
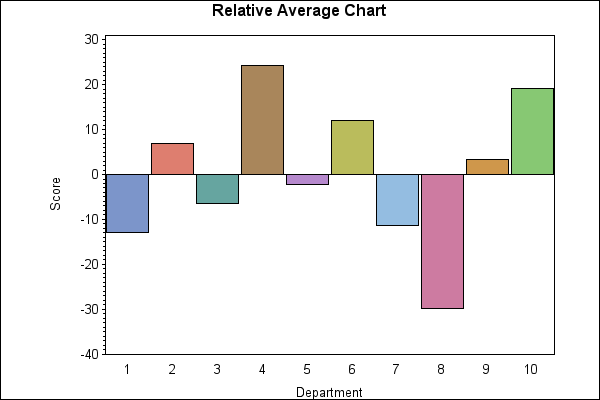
This sample illustrates how to generate a relative bar chart based upon the average response within each BY group.
| Type: | Sample |
| Topic: | SAS Reference ==> Procedures ==> GCHART Query and Reporting ==> Creating Reports ==> Graphical ==> Graph Types ==> Charts ==> Bar |
| Date Modified: | 2005-08-24 16:06:28 |
| Date Created: | 2004-11-11 11:07:54 |
Operating System and Release Information
| Product Family | Product | Host | SAS Release | |
| Starting | Ending | |||
| SAS System | SAS/GRAPH | All | n/a | n/a |