Sample 24878: Create a histogram with a normal density curve
 |  |  |  |  |
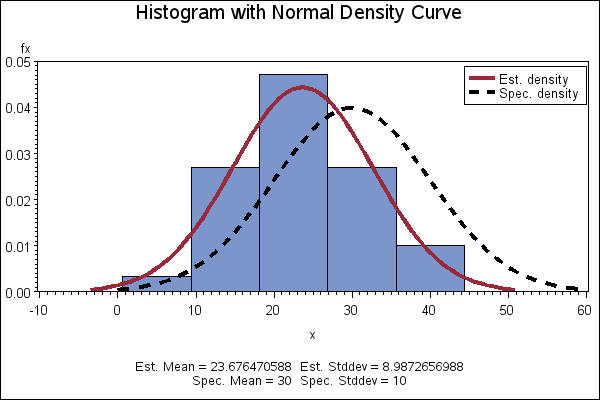
This sample produces a histogram with a normal parametric distribution curve with an optional additional user specified normal curve.
These sample files and code examples are provided by SAS Institute Inc. "as is" without warranty of any kind, either express or implied, including but not limited to the implied warranties of merchantability and fitness for a particular purpose. Recipients acknowledge and agree that SAS Institute shall not be liable for any damages whatsoever arising out of their use of this material. In addition, SAS Institute will provide no support for the materials contained herein.
This sample produces a histogram with a normal parametric distribution curve with an optional additional user specified normal curve.
The graphics output in the Results tab was produced using SAS® 9.2. Submitting the sample code with releases of SAS prior to SAS 9.2 might produce different results.
 /* Set the graphics environment */
goptions reset=all cback=white border htitle=12pt htext=10pt;

options linesize=137;

 /* Uncomment the line below for debugging */
* options symbolgen mlgoic mprint;

 /* First set the range of data for the distribution.              */
 /* If you set the low AND high ranges to 0, then the program will */
 /* get maximum and minimum values from the data and use these for */
 /* the data range.                                                */
 /*                                                                */
 /* Other parameters are also set from this section.               */
data setup;
%let lowrange=0;         /* Lowest bar category and highest bar      */
%let hirange= 0;         /* if both values are set to 0 then we will */
                         /* retrieve the low and high range from the */
                         /* data itself.  The ranges allow you to    */
                         /* eliminate outlying data or explore part  */
                         /* of the data easily                       */
%let barnum=5;           /* Number of bars in the distribution       */
%let ptnum=100;          /* Number of points drawn on the curve      */
%let barcolor='CX7C95CA';  /* Color of bars                            */
%let barpat=solid;       /* Pattern for the bars                     */
%let outline='black';    /* Color of the bar outline                 */
%let lineclr1 =depk;     /* Color of the curve line                  */
%let lineclr2 =black;    /* Color of user supplied distribution line */
%let linesty1=1;         /* Linestyle of the SAS-generated           */
                         /* distribution line                        */
%let linesty2=2;         /* Linestyle of user supplied line          */
%let curvewid=3;         /* Thickness of the line drawn on the curve */
%let mean2=30;           /* Mean of the curve you select vs. the     */
                         /* generated mean from the data             */
%let std2=10;            /* Std deviation on the curve you select vs.*/
                         /* the generated value from the data        */
%let drawline=join;      /* Draw the computed normal curve           */
                         /* 'none' turns off the line                */
%let drawlin2=join;      /* Draw the user specified line--'none'     */
                         /* turns off the line                       */
%let legend=frame;       /* Draws the specified legend frame         */
                         /* Set this to blank if drawline and        */
                         /* drawlin2 are set to none                 */
%let tailparm=3;         /* Number of std deviations on the curve,   */
                         /* The higher the value, the more tail on   */
                         /* the curve                                */
%let title1= Histogram with Normal Density Curve;      /* Title text */
%let tclr= black;           /* Color of the title                  */
%let theight =2;            /* Height of the title                 */
%let tfont='Albany AMT';    /* Font for the title                  */
%let label1=Est. density;   /* Label for computed normal curve     */
%let label2=Spec. density;  /* Label for user specified normal curve */
                            /* off if drawline is 'none'             */
%let fnote1a=Est. Mean = ;    /* Label for estimated mean footnote   */
%let fnote1b=Est. Stddev = ;  /* Label for estimated std footnote    */
%let fnote2a=Spec. Mean = ;   /* Label for user specified mean       */
                              /* turned off if drawline is none      */
%let fnote2b=Spec. Stddev = ; /* Label for the user specified deviation */
                              /* turned off if drawline is none         */
run;

 /* Read in the data */
data temp1;
  input xvar @@;
  datalines;
5 10 10 15 15 15 15 15 15 20 20 20 20 20 20 20 25
25 25 25 25 25 25 30 30 30 30 30 35 35 35 40 40 40
;
run;

proc sort;
  by xvar;
run;

 /* Now run PROC MEANS to create data that will be used to */
 /* generate the normal density curve in the next step.    */
proc means data=temp1 n var mean min max std sum;
  var xvar;
  output out=newmean var=var1 mean=mean1 std=std1 min=min1 max=max1 n=n1;
run;

 /* Store parameter estimates calculated by PROC MEANS as macro variables */
data newmean;
  set newmean;
  call symput('topn',n1);
  call symput('compmean',mean1);
  call symput('compstd',std1);
  call symput('compmin',min1);
  call symput('compmax',max1);
run;

 /* Generate a normal distribution curve from the data generated */
 /* from the PROC MEANS output                                   */
data curve1(keep=x fx min1 max1);
  set newmean;
  mu= mean1;                        /* Variance and mean */
  first=mu - &tailparm * std1;
  last=mu +  &tailparm * std1;
  byval=(last-first)/&ptnum;
  pi=arcos(-1);
  denom=1/sqrt(2*pi*var1);
  do x=first to last by byval;
     fx=denom*exp(-(x-mu)**2/(2* var1));
     output;
  end;
run;

 /* Generate a normal distribution curve using the */
 /* user supplied mean and standard deviation      */
%macro curveit(curve, mu, tailparm, std, ptnum2);
data &curve;
  first=&mu - &tailparm * &std;
  var1=&std ** 2;
  last=&mu +  &tailparm * &std;
  byval=(last-first)/&ptnum2;
  pi=arcos(-1);
  denom=1/sqrt(2*pi*var1);
  do x2=first to last by byval;
      fx2=denom*exp(-(x2-&mu)**2/(2* var1));
      output;
  end;
run;
%mend curveit;

%curveit(curve2, &mean2,&tailparm,&std2, &ptnum);

 /* Combine the two curve values into one data */
 /* set that we can use in the GPLOT step      */

 /* If the DRAWLINE parameter is set to none, then we want to eliminate */
 /* the second curve.  To do this we set values of the second curve     */
 /* equal to the values of the first curve                              */
data newcurve; merge curve1 (keep=x fx) curve2 (keep = x2 fx2);
  if "&drawline"="none" then do;
    call symput('mean','');
    call symput('std','');
    call symput('label1','');
    call symput('fnote1a','');
    call symput('fnote1b','');
  end;
  if "&drawlin2"="none" then do;
    call symput('mean2','');
    call symput('std2','');
    call symput('label2','');
    call symput('fnote2a','');
    call symput('fnote2b','');
    fx2=fx;
    x2=x;
  end;
run;

 /* This DATA step sorts the data into groups and sets the bounds        */
 /* for the midpoints of the vertical bars.  If the LOWRANGE and         */
 /* HIGHRANGE parameters are set to 0, we use the maximum                */
 /* and minimum values to set the range for the vertical bars.           */
 /* There are 3 DATA steps here because of the macro variables involved. */
data temp2;
  set temp1;
  if ((&lowrange=0) and (&hirange=0)) then do;
      call symput('lowrange',"&compmin");
      call symput('hirange',"&compmax");
   end;
run;

data temp2;
  set temp2;
  groupint=(&hirange-&lowrange)/(&barnum-1);
  call symput('groupint',groupint);
run;

data temp2;
  set temp2;
  do i = &lowrange to &hirange by &groupint;
    subtract=&groupint/2;
    lowbound =i-subtract;
    hibound=i+ subtract;
    if xvar>=lowbound and xvar <=hibound then group=i;
  end;
  output;
run;

data temp2;
  set temp2;
  subtract=&groupint/2;
  lowbound =group-subtract;
  hibound=group+ subtract;
run;

 /* Calculate the frequency for each group and                 */
 /* get the density value for the bar and the frequency value. */
proc freq data=temp2;
  tables group/out=newgrp1 ;
run;

data newgrp1;
  set newgrp1;
  density=   ((count/ &topn) / &groupint);

 /*  Because some of the midpoints will have no data, we must */
 /*  create bars with zero observations in them to merge with */
 /*  the original dataset so that all group bars are present. */
data grp0;
  do i = &lowrange to &hirange by &groupint;
    group=i;
    density=0;
    count=0;
    percent=0;
    output;
  end;
run;

data newgrp2;
  merge grp0 newgrp1;
  by group;
run;

 /* Create the boundaries for the midpoints for          */
 /* each bar in this step.  This controls the number     */
 /* of observations that will be represented by each bar */
data newgrp3;
  set newgrp2;
  by group;
  subtract=&groupint/2;
  lowbound =i-subtract;
  hibound=i+ subtract;
run;

 /* The dataset is now converted into ANNOTATE observations which can */
 /* be used to draw the bars                                          */
data anno3;
  set newgrp3;
  length function color style $ 8;
  xsys='2'; ysys='2';
  function='move'; x=lowbound; y=0; output;
  function='poly'; x=lowbound; y=0; color=&barcolor; style='solid'; output;
  function='polycont'; x=lowbound; y=density; color=&barcolor;
  style='solid'; output;
  function='polycont'; x=hibound;  y=density; color=&barcolor;
  style='solid'; output;
  function='polycont'; x=hibound;  y=0; color=&barcolor; output;
  style='solid'; output;
  function='move'; x=lowbound; y=0; output;
  function='draw'; x=lowbound; y=density; color=&outline; output;
  function='draw'; x=hibound; y=density; color=&outline; output;
  function='draw'; x=hibound; y=0; color=&outline; output;
  function='draw'; x=lowbound; y=0; color=&outline; output;
run;

 /* We then figure out which is taller--the maximum curve value */
 /* or the maximum bar value.  This is used to determine the    */
 /* vertical axis range for the plot.                           */
proc means data=newgrp2 max;
  var density;
  output out=maxgrp max=maxgrp1;
run;

proc means data=curve1 max;
  var fx;
  output out=maxcurve max=maxcrv1;
run;

proc means data=curve2 max;
  var fx2;
  output out=maxcurv2 max=maxcrv2;
run;

 /* This DATA step determines the maximum value (either */
 /* one of the curve values or the bar density),        */
 /* and then adds .005 and rounds it to the nearest     */
 /* hundredth so that the axis ordering can be in equal */
 /* values.  It does not affect the charting data.      */
data maxaxis;
  merge maxgrp maxcurve maxcurv2;
  if (maxgrp1 >= maxcrv1) then maxaxis=maxgrp1;
  else maxaxis=maxcrv1;
  if (maxaxis >= maxcrv2) then maxaxis=maxaxis;
  else maxaxis=maxcrv2;
  maxaxisr=maxaxis + .005;
  maxaxisr=round(maxaxisr, .01);
  call symput('maxaxisr',maxaxisr);
run;
 /*
proc print data=maxaxis;
  title 'maximum values for group and curve values';
run;
 */

 /* We then plot the generated curve data and use the ANNOTATE */
 /* data set to draw the bars.                                 */
proc gplot data=newcurve anno=anno3;
  Title1 h=&theight f=&tfont c=&tclr "&title1" ;
  axis1 order=(0 to &maxaxisr by .01) offset=(0);
  legend1 position=(top right inside) mode=protect across=1
          value=("&label1" "&label2")  label=none &legend;
  plot fx * x fx2 * x2/overlay vaxis=axis1 legend=legend1;
  symbol1 c=&lineclr1 l=&linesty1 i=&drawline v=none w=&curvewid;
  symbol2 c=&lineclr2 l=&linesty2 i=&drawlin2 v=none w=&curvewid;
  footnote1 c=black f='Albany AMT'
   "&fnote1a &compmean  &fnote1b &compstd";
  footnote2 c=black f='Albany AMT'
   "&fnote2a &mean2  &fnote2b &std2";
  footnote3 '  ';
run;
quit;
These sample files and code examples are provided by SAS Institute Inc. "as is" without warranty of any kind, either express or implied, including but not limited to the implied warranties of merchantability and fitness for a particular purpose. Recipients acknowledge and agree that SAS Institute shall not be liable for any damages whatsoever arising out of their use of this material. In addition, SAS Institute will provide no support for the materials contained herein.
This sample produces a histogram with a normal parametric distribution curve with an optional additional user specified normal curve.
| Type: | Sample |
| Topic: | Query and Reporting ==> Creating Reports ==> Graphical ==> Graph Elements ==> Annotation Query and Reporting ==> Creating Reports ==> Graphical ==> Graph Types ==> Plots ==> Other Plots SAS Reference ==> Procedures ==> GPLOT |
| Date Modified: | 2005-08-24 16:06:27 |
| Date Created: | 2004-11-11 11:07:54 |
Operating System and Release Information
| Product Family | Product | Host | SAS Release | |
| Starting | Ending | |||
| SAS System | SAS/GRAPH | All | n/a | n/a |