Sample 24876: Stacked bar chart representing on/off states of a constant
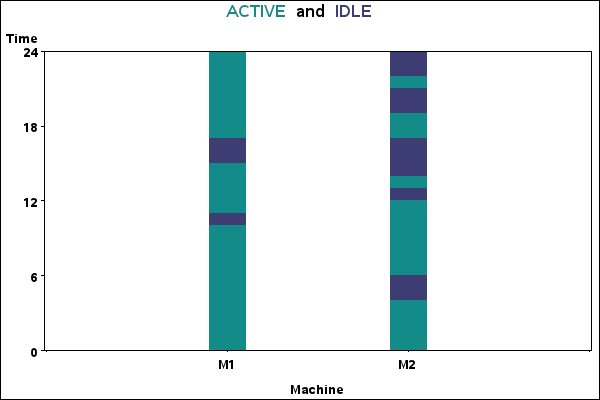
This sample code produces a stacked bar chart representing on/off states of a constant, such as the running/idle times of a computer. The Annotate facility is used to draw the bars of the chart.
These sample files and code examples are provided by SAS Institute
Inc. "as is" without warranty of any kind, either express or implied, including
but not limited to the implied warranties of merchantability and fitness for a
particular purpose. Recipients acknowledge and agree that SAS Institute shall
not be liable for any damages whatsoever arising out of their use of this material.
In addition, SAS Institute will provide no support for the materials contained herein.
This sample code produces a stacked bar chart representing on/off states of a constant, such as the running/idle times of a computer. The Annotate facility is used to draw the bars of the chart.
The graphics output in the Results tab was produced using SAS® 9.2. Submitting the sample code with releases of SAS prior to SAS 9.2 might produce different results.
 /* Set the graphics environment */
goptions reset=all border cback=white htitle=13pt
           htext=10pt ftext='Albany AMT/bold';

 /* Create input data set, A */
data a;
   input Machine Type $ Time;
   datalines;
1 running 10
1 idle    1
1 running 4
1 idle    2
1 running 7
2 running 4
2 idle    2
2 running 6
2 idle    1
2 running 1
2 idle    3
2 running 2
2 idle    2
2 running 1
2 idle    2
;
run;

proc sort data=a out=a;
   by machine;
run;

 /* Create the annotate data set ANNO */
data anno;
   length function color $ 8;

  /* The BAR function is used to draw a fillable */
  /* rectangle whose lower-left corner is defined*/
  /* by the internal variables (XLAST,YLAST) and */
  /* whose upper-right corner is defined by the  */
  /* (X,Y) variable pair.                        */

   retain function 'bar' xsys '2' style 'solid' time2 0;
   set a;
   by machine;

   if first.machine then time2=0;

   function='move'; x=machine; xsys='2'; ysys='2'; y=time2; output;
   function='move'; xsys='9'; x=-3; y=time2; output;

   if type = 'running' then color='vibg';
   if type = 'idle'    then color='mob';

   function='bar';  xsys='9'; x=+6; ysys='2'; y=time2+time; output;
   time2=time2+time;
   y=0;
run;

 /* Create the axis definitions */
axis1 order=(0 to 3 by 1) value=('' 'M1' 'M2' '')
      major=(h=.001) minor=none;
axis2 order=(0 to 24 by 6) offset=(0) minor=none;

 /* Assign symbol characteristics */
symbol1 i=none v=none;

 /* Add a title to the graph */
title1 c=vibg 'ACTIVE' c=black '  and  ' c=mob 'IDLE';

 /* Produce the plot */
proc gplot data=a;
   plot time*machine / anno=anno haxis=axis1 vaxis=axis2 frame;
run;
quit;
These sample files and code examples are provided by SAS Institute
Inc. "as is" without warranty of any kind, either express or implied, including
but not limited to the implied warranties of merchantability and fitness for a
particular purpose. Recipients acknowledge and agree that SAS Institute shall
not be liable for any damages whatsoever arising out of their use of this material.
In addition, SAS Institute will provide no support for the materials contained herein.
This sample code produces a stacked bar chart representing on/off states of a constant, such as the running/idle times of a computer. The Annotate facility is used to draw the bars of the chart.
| Type: | Sample |
| Topic: | SAS Reference ==> Procedures ==> GCHART
Query and Reporting ==> Creating Reports ==> Graphical ==> Graph Types ==> Charts ==> Bar
|
| Date Modified: | 2005-08-24 16:06:27 |
| Date Created: | 2004-11-11 11:07:54 |
Operating System and Release Information
| SAS System | SAS/GRAPH | All | n/a | n/a |


