Sample 24873: Control the placement of statistics with PROC GCHART
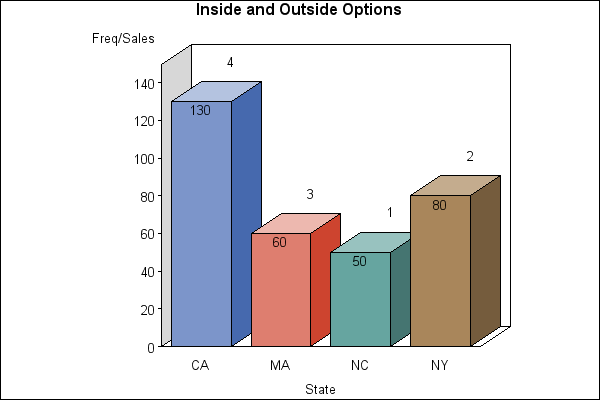
This sample uses PROC GCHART with the INSIDE and OUTSIDE options on a VBAR3D statement to label statistics inside and outside the bars. You can also use these options with the VBAR statement, but not with the HBAR and HBAR3D statements.
These sample files and code examples are provided by SAS Institute
Inc. "as is" without warranty of any kind, either express or implied, including
but not limited to the implied warranties of merchantability and fitness for a
particular purpose. Recipients acknowledge and agree that SAS Institute shall
not be liable for any damages whatsoever arising out of their use of this material.
In addition, SAS Institute will provide no support for the materials contained herein.
This sample uses PROC GCHART with the INSIDE and OUTSIDE options on a VBAR3D statement to label statistics inside and outside the bars. You can also use these options with the VBAR statement, but not with the HBAR and HBAR3D statements.
The graphics output in the Results tab was produced using SAS® 9.2. Submitting the sample code with releases of SAS prior to SAS 9.2 might produce different results.
 /* Set the graphics environment */
goptions reset=all border cback=white
         htitle=12pt htext=10pt;

 /* Define a data set for charting */
data a;
   input State $ Sales;
   datalines;
NC 50
NY 10
NY 70
MA 10
MA 20
MA 30
CA 90
CA 10
CA 10
CA 20
;
run;

title1 'Inside and Outside Options';

axis1 label=('Freq/Sales') minor=none
      order=(0 to 140 by 20);
axis2 label=('State');

 /* Use the INSIDE= option to place    */
 /* the SUM values inside the bars.    */
 /* Use the OUTSIDE= option to place   */
 /* the FREQ values outside the bars.  */
proc gchart data=a;
   vbar3d state / sumvar=sales inside=sum
                  outside=freq subgroup=state
                  nolegend
	          width=12 space=4
                  raxis=axis1 maxis=axis2;
run;
quit;
These sample files and code examples are provided by SAS Institute
Inc. "as is" without warranty of any kind, either express or implied, including
but not limited to the implied warranties of merchantability and fitness for a
particular purpose. Recipients acknowledge and agree that SAS Institute shall
not be liable for any damages whatsoever arising out of their use of this material.
In addition, SAS Institute will provide no support for the materials contained herein.
This sample uses PROC GCHART with the INSIDE and OUTSIDE options on a VBAR3D statement to label statistics inside and outside the bars. You can also use these options with the VBAR statement, but not with the HBAR and HBAR3D statements.
| Type: | Sample |
| Topic: | SAS Reference ==> Procedures ==> GCHART
Query and Reporting ==> Creating Reports ==> Graphical ==> Graph Types ==> Charts ==> Bar
|
| Date Modified: | 2005-08-24 16:06:26 |
| Date Created: | 2004-11-11 11:07:53 |
Operating System and Release Information
| SAS System | SAS/GRAPH | All | n/a | n/a |


