Sample 24871: Use PROC GCHART with Annotate to add bars at +/- 1, 2 or 3 STD or STDERR of the mean
 |  |  |  |  |
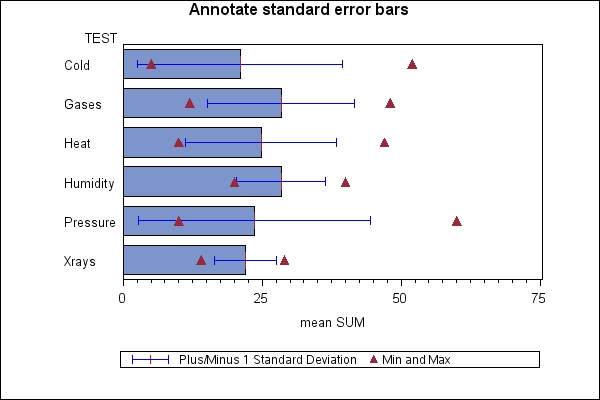
This program uses PROC GCHART with the Annotate facility to overlay bars at +/- 1, 2, or 3 STD (standard deviations) or STDERR (standard errors) of the mean on an HBAR chart. The MIN and MAX values for each midpoint are also shown.
These sample files and code examples are provided by SAS Institute Inc. "as is" without warranty of any kind, either express or implied, including but not limited to the implied warranties of merchantability and fitness for a particular purpose. Recipients acknowledge and agree that SAS Institute shall not be liable for any damages whatsoever arising out of their use of this material. In addition, SAS Institute will provide no support for the materials contained herein.
This program uses PROC GCHART with the Annotate facility to overlay bars at +/- 1, 2, or 3 STD (standard deviations) or STDERR (standard errors) of the mean on an HBAR chart. The MIN and MAX values for each midpoint are also shown.
The graphics output in the Results tab was produced using SAS® 9.2. Submitting the sample code with releases of SAS prior to SAS 9.2 might produce different results.
 /* Set the graphics environment */
goptions reset=all cback=white border htitle=12pt htext=10pt;

%let stat=std;  /* At this point your choices are either std or stderr. */
%let num=1;     /* Choose either, 1, 2, or 3 for the number of std or   */
                /* stderr of the mean.                                  */

 /* Create a sample data set */
data a;
  input TEST $8. BREAKS;
  datalines;
Cold      5
Cold     12
Cold     14
Cold     22
Cold     52
Heat     20
Heat     25
Heat     10
Heat     22
Heat     47
Gases    12
Gases    25
Gases    33
Gases    48
Gases    24
Pressure 10
Pressure 12
Pressure 14
Pressure 22
Pressure 60
Xrays    20
Xrays    25
Xrays    14
Xrays    22
Xrays    29
Humidity 20
Humidity 25
Humidity 33
Humidity 40
Humidity 24
;
run;

 /* Sort data by variable TEST */
proc sort data=a;
  by TEST;
run;

 /* Create an output data set B using PROC MEANS   */
 /* that contain new variables MEAN, STD, STDERR,  */
 /* MIN, and MAX.                                  */
proc means mean std stderr min max data=a;
  by TEST;
  output out=b mean=mean std=std stderr=stderr min=min max=max;
run;

 /* Create an annotate data set, ANNO, to draw the bars at +/- 1, */
 /* 2, or 3 Standard Deviation or Standard Error of the mean.     */
data anno;
  length color function style $8;
  retain xsys ysys '2' when 'a' ;
  set b;
  function='move'; xsys='2'; ysys='2'; midpoint=TEST; x=mean; color='blue'; output;
  function='draw'; x=mean-(&num*&stat); color='blue'; width=2; output;
  function='draw'; x=mean+(&num*&stat);  color='blue'; width=2; output;

  function='move'; midpoint=TEST; x=mean; color='depk'; output;
  function='draw'; x=mean; ysys='9'; y=+2; width=2; output;
  function='draw'; x=mean; y=-4; width=2; output;

  function='move'; x=mean-(&num*&stat); ysys='2'; midpoint=TEST;
                   color='blue'; width=2; output;
  function='draw'; ysys='9'; y=+1; width=2; output;
  function='draw';           y=-2; width=2; output;

  function='move'; x=mean+(&num*&stat); ysys='2'; midpoint=TEST;
                   color='blue'; width=2; output;
  function='draw'; ysys='9'; y=+1; width=2; color='blue'; output;
  function='draw';           y=-2; width=2; color='blue'; output;

  function='label'; xsys='2'; ysys='2'; x=min; style='marker';
                   size=1; text='C'; color='depk'; output;
  function='label'; xsys='2'; ysys='2'; x=max; style='marker';
                   size=1; text='C'; color='depk'; output;
run;

 /* Create an annotate data set, ANNO2, that draws the legend for the graph. */
data anno2;
  length function $ 8  text style  $ 45;
  retain xsys '2' ysys '1' when 'a' line 2 function 'label' hsys '3' size .5;

  function='move'; xsys='3'; ysys='3'; x=20; y=8; line=1; color='black'; output;
  function='draw'; x=20; y=12; output;
  function='draw'; x=90; y=12; output;
  function='draw'; x=90; y=8; output;
  function='draw'; x=20; y=8; output;

  function='move'; xsys='3'; ysys='3'; x=22; y=10; line=1; color='blue'; output;
  function='draw'; xsys='3'; ysys='9'; x=22; y=+1; line=1; color='blue'; output;
  function='draw'; xsys='3'; ysys='9'; x=22; y=-2; line=1; color='blue'; output;

  function='move'; xsys='3'; ysys='3'; x=25; y=10; line=1; color='red'; output;
  function='draw'; xsys='3'; ysys='9'; x=25; y=+1; line=1; color='red'; output;
  function='draw'; xsys='3'; ysys='9'; x=25; y=-2; line=1; color='red'; output;

  function='move'; xsys='3'; ysys='3'; x=28; y=10; line=1; color='blue'; output;
  function='draw'; xsys='3'; ysys='9'; x=28; y=+1; line=1; color='blue'; output;
  function='draw'; xsys='3'; ysys='9'; x=28; y=-2; line=1; color='blue'; output;

  function='move'; xsys='3'; ysys='3'; x=22; y=10; line=1; color='blue'; output;
  function='draw'; xsys='3'; ysys='3'; x=28; y=10; line=1; color='blue'; output;

  function='label'; xsys='3'; ysys='3'; x=30; y=10.5;
                           style="'Albany AMT'"; position='6';size=3;
  if "&stat"='std' then text=("Plus/Minus &num Standard Deviation");
  if "&stat"='stderr' then text=("Plus/Minus &num Standard Error of the Mean");
  color='black'; output;
  function='label'; xsys='9'; x=+2; y=10.1; style='marker';
                           size=2; text='C'; color='depk'; output;
  function='label'; xsys='9'; x=+1; y=10.5; style="'Albany AMT'";
                           size=3; text='Min and Max'; color='black'; output;

run;

 /* Create axis definitions */
axis1 order=(0 to 75 by 25) length=70 pct origin=(20.5,30) pct;

 /* Add a title to the graph */
title1 'Annotate standard error bars';

 /* Create the graph using the ANNO=    */
 /* option on the PROC GCHART statement */
 /* and the HBAR statement              */
proc gchart data=b anno=anno2;
  hbar TEST / raxis=axis1 nostats anno=anno frame
              sumvar=mean;
run;
quit;
These sample files and code examples are provided by SAS Institute Inc. "as is" without warranty of any kind, either express or implied, including but not limited to the implied warranties of merchantability and fitness for a particular purpose. Recipients acknowledge and agree that SAS Institute shall not be liable for any damages whatsoever arising out of their use of this material. In addition, SAS Institute will provide no support for the materials contained herein.
This program uses PROC GCHART with the Annotate facility to overlay bars at +/- 1, 2, or 3 STD (standard deviations) or STDERR (standard errors) of the mean on an HBAR chart. The MIN and MAX values for each midpoint are also shown.
| Type: | Sample |
| Topic: | SAS Reference ==> Procedures ==> GCHART Query and Reporting ==> Creating Reports ==> Graphical ==> Graph Elements ==> Annotation Query and Reporting ==> Creating Reports ==> Graphical ==> Graph Types ==> Charts ==> Bar |
| Date Modified: | 2008-01-18 15:10:20 |
| Date Created: | 2004-11-11 11:07:53 |
Operating System and Release Information
| Product Family | Product | Host | SAS Release | |
| Starting | Ending | |||
| SAS System | SAS/GRAPH | All | n/a | n/a |