Sample 24864: Overlay a vertical bar chart with a plot line and a right vertical axis with PROC GREPLAY
 |  |  |  |  |
This example creates a bar chart and a line plot and then uses GREPLAY to replay them on top of one another.
These sample files and code examples are provided by SAS Institute Inc. "as is" without warranty of any kind, either express or implied, including but not limited to the implied warranties of merchantability and fitness for a particular purpose. Recipients acknowledge and agree that SAS Institute shall not be liable for any damages whatsoever arising out of their use of this material. In addition, SAS Institute will provide no support for the materials contained herein.
This sample code creates a bar chart and a line plot and then uses GREPLAY to replay them on top of one another.
The graphics output in the Results tab was produced using SAS® 9.2. Submitting the sample code with releases of SAS prior to SAS 9.2 might produce different results.
 /* Set the graphics environment */
goptions reset=all border cback=white htitle=12pt;

 /* Delete all of the old graphs from the */
 /* WORK.GSEG catalog                     */
proc greplay igout=work.gseg nofs;
   delete _all_;
run;
quit;

 /* Create the input data set, SALES */
data sales;
   input Quarter $ 1-1 Sales 3-5;
   datalines;
1 400
2 600
3 750
4 900
;
run;

 /* Assign axis definitions for the */
 /* bar chart.                      */
axis1 origin=(20,20)pct length=60 pct
      order=(0 to 1000 by 100) minor=none
      label=('Sales');
axis2 origin=(20,20)pct length=50 pct;

 /* Assign pattern characteristics */
pattern1 value=solid color=vibg;

title1 'Overlay a bar graph and line plot with GREPLAY';

 /* Use the NODISPLAY graphics option when */
 /* creating the original graphs.          */
goptions device=gif nodisplay xpixels=600 ypixels=400
         border;

 /* Produce the Vertical Bar Chart */
proc gchart data=sales gout=work.gseg;
   vbar quarter / sumvar=sales raxis=axis1 maxis=axis2
                  width=9 space=5.5;
run;
quit;

 /* Create the input data set, EARNINGS */
data earnings;
   input quarter earnings;
   datalines;
1 10
2 17
3 25
4 32
;
run;

 /* Assign axis definitions for the  */
 /* line plot.                       */
axis1 order=(0 to 40 by 10) value=none origin=(20,20) pct length=60 pct
      label=none major=none minor=none ;
axis2 order=(1 to 4 by 1) value=none origin=(20,20) pct length=50 pct
      label=none major=none minor=none offset=(5.5,5.5) pct;
axis3 order=(0 to 40 by 10) origin=(70,20) pct length=60 pct
      minor=none label=('Earnings');

 /* Define symbol characteristics */
symbol1 i=join v=dot  c=depk w=2 h=1.5;
symbol2 i=join v=dot  c=depk w=2 h=1.5;

 /* Add footnotes to create a legend */
footnote1 c=vibg move=(30,3)pct f=marker 'U' f='Albany AMT' c=black '  Sales';
footnote2 c=depk move=(45,3)pct '______' c=black font='Albany AMT' '  Earnings';

title1;

 /* Produce the plot */
proc gplot gout=work.gseg data=earnings;
   plot earnings * quarter / vaxis=axis1 haxis=axis2;
   plot2 earnings * quarter / vaxis=axis3;
run;
quit;

 /* Reset the GOPTIONS for use with GREPLAY */
goptions reset=all border;

 /* Use PROC GREPLAY to overlay the chart and the plot */
 /* using the WHOLE template that is shipped in        */
 /* SASHELP.TEMPLT.                                    */
proc greplay igout=work.gseg nofs tc=sashelp.templt
     template=whole;
   treplay 1:gchart 1:gplot;
run;
quit;
These sample files and code examples are provided by SAS Institute Inc. "as is" without warranty of any kind, either express or implied, including but not limited to the implied warranties of merchantability and fitness for a particular purpose. Recipients acknowledge and agree that SAS Institute shall not be liable for any damages whatsoever arising out of their use of this material. In addition, SAS Institute will provide no support for the materials contained herein.
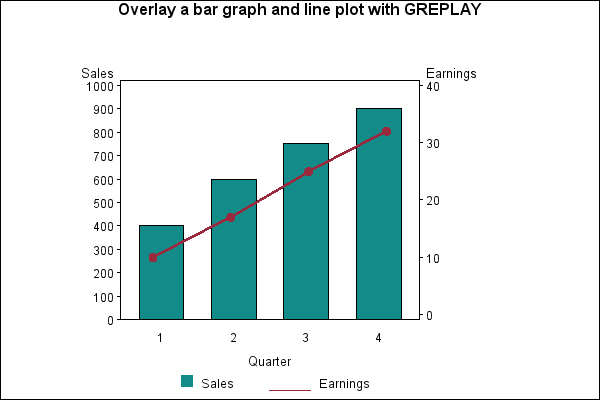
This example creates a bar chart and a line plot and then uses GREPLAY to replay them on top of one another.
| Type: | Sample |
| Topic: | Query and Reporting ==> Creating Reports ==> Graphical ==> Graph Types ==> Charts ==> Bar SAS Reference ==> Procedures ==> GCHART |
| Date Modified: | 2005-08-24 16:06:24 |
| Date Created: | 2004-11-11 11:07:52 |
Operating System and Release Information
| Product Family | Product | Host | SAS Release | |
| Starting | Ending | |||
| SAS System | SAS/GRAPH | All | n/a | n/a |