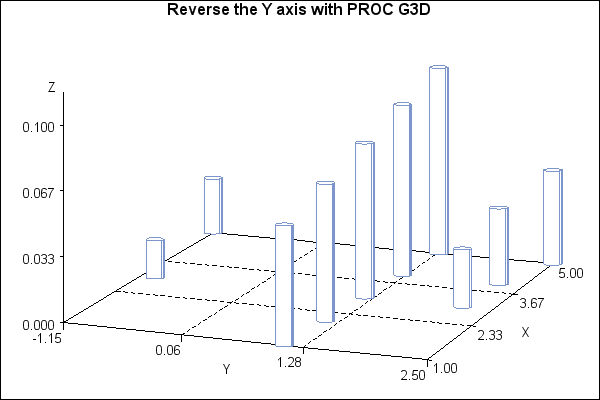
Sample 24859: Reverse the Y axis with PROC G3D
This sample uses PROC G3D to reverse the values on the Y axis. The sample code multiplies the Y data values by -1 in order to reverse the axis order. A user-defined format is then created with PROC FORMAT to format the new Y axis values back to their original values.
These sample files and code examples are provided by SAS Institute
Inc. "as is" without warranty of any kind, either express or implied, including
but not limited to the implied warranties of merchantability and fitness for a
particular purpose. Recipients acknowledge and agree that SAS Institute shall
not be liable for any damages whatsoever arising out of their use of this material.
In addition, SAS Institute will provide no support for the materials contained herein.
This sample uses PROC G3D to reverse the values on the Y axis. The sample code multiplies the Y data values by -1 in order to reverse the axis order. A user-defined format is then created with PROC FORMAT to format the new Y axis values back to their original values.
The graphics output in the Results tab was produced using SAS® 9.2. Submitting
the sample code with releases of SAS prior to SAS 9.2 might produce different results.
 /* Set the graphics environment */
goptions reset=all cback=white border htitle=12pt htext=10pt;

 /* Create a format */
proc format;
  picture rev
          low - < 0   = '00009.00'
          0 < - high  = '00009.00' (prefix='-');
run;

 /* Create a sample data set */
data one;
   input Y X Z;
   datalines;
-1.15 5 .03
-1.00 3 .02
2.20 3 .03
2.25 4 .04
2.50 5 .05
1.10 1 .06
1.15 2 .07
1.20 3 .08
1.25 4 .09
1.30 5 .10
;

 /* Create data set TWO, multiplying */
 /* the Y values by -1               */
data two;
   set one;
   Y=-1*Y;
run;

 /* Add a title to the graph */
title1 'Reverse the Y axis with PROC G3D';

 /* Create the graph, making sure to  */
 /* format the Y axis values          */
proc g3d data=two;
   scatter Y * X = Z / shape='pillar' color='CX7C95CA' size=2 zmin=0;
   format Y REV.;
run;
quit;
These sample files and code examples are provided by SAS Institute
Inc. "as is" without warranty of any kind, either express or implied, including
but not limited to the implied warranties of merchantability and fitness for a
particular purpose. Recipients acknowledge and agree that SAS Institute shall
not be liable for any damages whatsoever arising out of their use of this material.
In addition, SAS Institute will provide no support for the materials contained herein.
This sample uses PROC G3D to reverse the values on the Y axis. The sample code multiplies the Y data values by -1 in order to reverse the axis order. A user-defined format is then created with PROC FORMAT to format the new Y axis values back to their original values.
| Type: | Sample |
| Topic: | SAS Reference ==> Procedures ==> G3D
|
| Date Modified: | 2005-08-24 16:06:23 |
| Date Created: | 2004-11-11 11:07:51 |
Operating System and Release Information
| SAS System | SAS/GRAPH | All | n/a | n/a |


