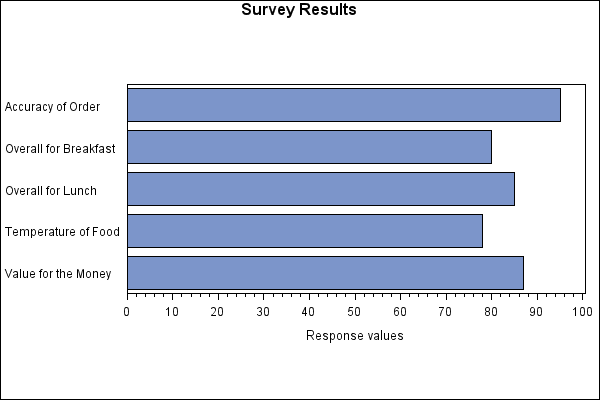
Sample 24856: Use PROC GCHART with midpoint values longer than 16 characters
Beginning with Version 8 of SAS/GRAPH®, there is no longer a 16 character limit for axis labels and values. The limit has been increased to 32 characters.
These sample files and code examples are provided by SAS Institute
Inc. "as is" without warranty of any kind, either express or implied, including
but not limited to the implied warranties of merchantability and fitness for a
particular purpose. Recipients acknowledge and agree that SAS Institute shall
not be liable for any damages whatsoever arising out of their use of this material.
In addition, SAS Institute will provide no support for the materials contained herein.
Beginning with Version 8 of SAS/GRAPH®, there is no longer a 16 character limit for axis labels and values. The limit has been increased to 32 characters.
The graphics output in the Results tab was produced using SAS® 9.2. Submitting the sample code with releases of SAS prior to SAS 9.2 might produce different results.
 /* Set the graphics environment */
goptions reset=all border cback=white htitle=12pt;

 /* Create data set A */
data a;
   input midvar $ 1-21 respvar;
   datalines;
Accuracy of Order       95
Overall for Breakfast   80
Overall for Lunch       85
Temperature of Food     78
Value for the Money     87
;
run;

 /* Specify AXIS statements */
axis1 label=none;
axis2 label=('Response values');

 /* Add a TITLE to the graph */
title1 'Survey Results';

 /* Create the graph */
proc gchart data=a;
   hbar midvar / maxis=axis1 raxis=axis2
                 sumvar=respvar nostats;
run;
quit;
These sample files and code examples are provided by SAS Institute
Inc. "as is" without warranty of any kind, either express or implied, including
but not limited to the implied warranties of merchantability and fitness for a
particular purpose. Recipients acknowledge and agree that SAS Institute shall
not be liable for any damages whatsoever arising out of their use of this material.
In addition, SAS Institute will provide no support for the materials contained herein.
Beginning with Version 8 of SAS/GRAPH®, there is no longer a 16 character limit for axis labels and values. The limit has been increased to 32 characters.
| Type: | Sample |
| Topic: | SAS Reference ==> Procedures ==> GCHART
Query and Reporting ==> Creating Reports ==> Graphical ==> Graph Types ==> Charts ==> Bar
|
| Date Modified: | 2005-08-24 16:06:22 |
| Date Created: | 2004-11-11 11:07:51 |
Operating System and Release Information
| SAS System | SAS/GRAPH | z/OS | 9.1 TS1M0 | |
| Microsoft® Windows® for 64-Bit Itanium-based Systems | 9.1 TS1M0 | |
| Microsoft Windows Server 2003 Datacenter 64-bit Edition | 9.1 TS1M0 | |
| Microsoft Windows Server 2003 Enterprise 64-bit Edition | 9.1 TS1M0 | |
| Microsoft Windows 2000 Advanced Server | 9.1 TS1M0 | |
| Microsoft Windows 2000 Datacenter Server | 9.1 TS1M0 | |
| Microsoft Windows 2000 Server | 9.1 TS1M0 | |
| Microsoft Windows 2000 Professional | 9.1 TS1M0 | |
| Microsoft Windows NT Workstation | 9.1 TS1M0 | |
| Microsoft Windows Server 2003 Datacenter Edition | 9.1 TS1M0 | |
| Microsoft Windows Server 2003 Enterprise Edition | 9.1 TS1M0 | |
| Microsoft Windows Server 2003 Standard Edition | 9.1 TS1M0 | |
| Microsoft Windows XP Professional | 9.1 TS1M0 | |
| 64-bit Enabled AIX | 9.1 TS1M0 | |
| 64-bit Enabled HP-UX | 9.1 TS1M0 | |
| 64-bit Enabled Solaris | 9.1 TS1M0 | |
| HP-UX IPF | 9.1 TS1M0 | |
| Linux | 9.1 TS1M0 | |
| OpenVMS Alpha | 9.1 TS1M0 | |
| Tru64 UNIX | 9.1 TS1M0 | |


