Usage Note 24299: Plotting more than one theoretical distribution on one graph
 |  |  |
Part 1: Fitting separate distributions for each of several variables or BY groups
In PROC UNIVARIATE and PROC CAPABILITY, the method for fitting multiple distributions from the same theoretical family to each of multiple variables or BY groups is to generate multiple comparative plots in a one-way or two-way layout. Comparative histograms, probability plots, and quantile-quantile plots are produced in PROC UNIVARIATE when you specify the CLASS statement along with a HISTOGRAM, PROBPLOT, or QQPLOT statement. In PROC CAPABILITY, comparative histograms are produced by using the CLASS= option in the COMPHISTOGRAM statement. The graphs will be separate plots automatically scaled the same to facilitate direct comparisons. You can control the number of distinct plots to display per page using the NROWS= and NCOLS= plot statement options. If you want to display multiple theoretical distributions on one graph in the same set of axes, you can use PROC GREPLAY to produce an overlay effect by replaying multiple graphs in the same template. Beginning in SAS® 9.2, you can use PROC SGPLOT to automatically generate overlaid comparative plots. Side-by-side histograms that use the same axes are available in PROC GCHART, but there are no options for displaying theoretical distributions
These statements generate a test data set with two groups:
drop i;
do group='A','B';
do i=1 to 100;
if group='A' then x=25 + 8*rannor(2345);
else x=5 + 8*rannor(12345);
output;
end;
end;
run;
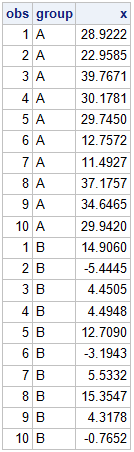
This is the required data arrangement for comparative plots in PROC UNIVARIATE and PROC CAPABILITY. Here are the first 10 observations in each BY group:
Comparative plots using PROC UNIVARIATE or PROC CAPABILITY
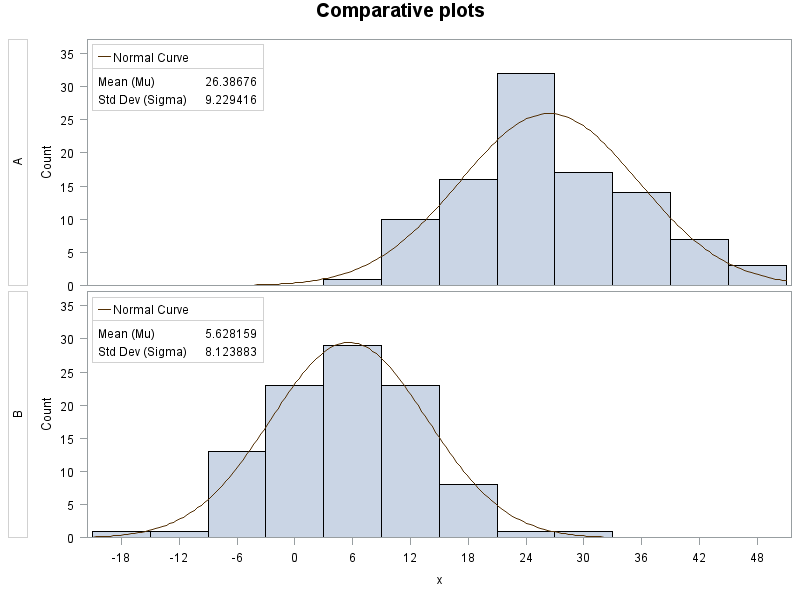
When you use the CLASS and plotting statements in PROC UNIVARIATE or the CLASS= option in the COMPHIST statement in PROC CAPABILITY, the axes are automatically scaled the same across all plots.
proc univariate data=test noprint;
class group;
var x;
histogram x / vscale=count normal(noprint);
inset normal(mu sigma);
run;
title;
The preceding statements produce this graph:
Overlaid Plots using PROC SGPLOT
Overlaid plots can be easily generated using PROC SGPLOT beginning in SAS 9.2. To generate a similar plot to the previous example, you need to have separate variables instead of BY groups. If you have your measures stacked in one column as in the data set above, this code shows how you can reshape the data set and generate the plot:
by group;
var x;
run;
proc transpose data= interim out=test2(drop=_name_);
id group;
run;
The data set now has the layout in the following partial print showing the first 10 observations:
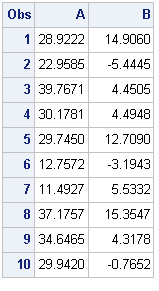
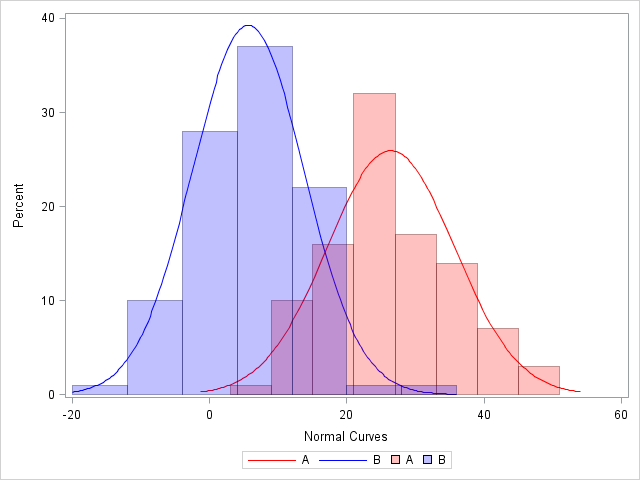
With separate variables, PROC SGPLOT can be used to easily generate an overlaid plot.
density A / type=normal lineattrs=(color=red) legendlabel='A';
density B / type=normal lineattrs=(color=blue) legendlabel='B';
histogram A / transparency=0.75 fillattrs=(color=red);
histogram B / transparency=0.75 fillattrs=(color=blue);
keylegend / location=outside position=bottom;
xaxis label="Normal Curves";
run;
The preceding statements produce this graph:
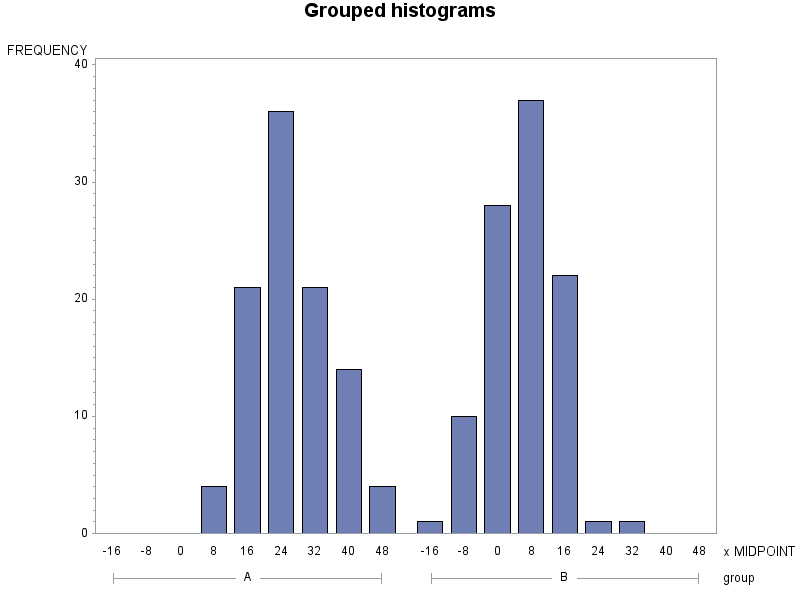
Grouped Histograms using PROC GCHART
Grouped histograms can be created using PROC GCHART, but no distribution options are available.
proc gchart data=test;
vbar x / group=group;
run;
title;
The preceding statements produce this graph:
Overlaid Plots using PROC GREPLAY
The following statements delete all of the previous graphs that have been written to the WORK.GSEG catalog:
%if %sysfunc(cexist(&catname))
%then %do;
proc greplay nofs igout=&catname;
delete _all_;
run;
quit;
%end;
%mend delcat;
%delcat(work.gseg)
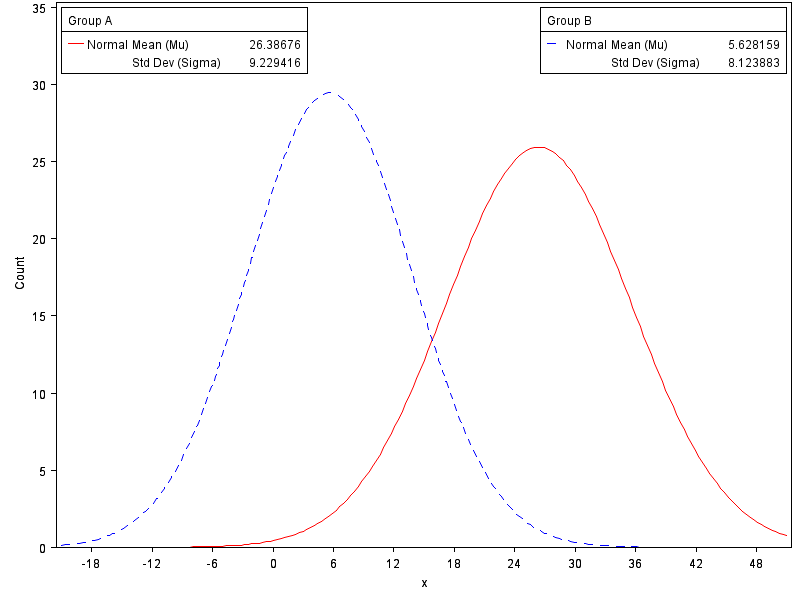
Run the two plots separately and store them in a graphics catalog. ODS Graphics must be disabled. Use AXIS options to ensure the same scaling on both plots. You can use the NODISPLAY option in a GOPTIONS statement to suppress the individual histograms from being displayed. The DISPLAY graphics option prior to PROC GREPLAY displays only the template of graphs.
goptions nodisplay;
ods graphics off;
axis1 order=(0 to 35 by 5) value=(h=2) label=(h=2);
proc univariate data=test noprint;
where group='A';
var x;
histogram x / normal(noprint color=red)
nobars
name='A'
midpoints=-18 to 48 by 6
vscale=count
vaxis=axis1
height=2;
inset normal(mu sigma) / pos=nw header='Group A' height=2;
run;
quit;
proc univariate data=test noprint;
where group='B';
var x;
histogram x / normal(noprint color=blue l=20)
nobars
name='B'
midpoints=-18 to 48 by 6
vscale=count
vaxis=axis1
height=2;
inset normal(mu sigma) / pos=ne header='Group B' height=2;
run;
quit;
goptions display;
/* Replay the graphs into the same template */
proc greplay igout=work.gseg nofs tc=sashelp.templt template=whole;
treplay 1:A 1:B;
run;
ods graphics on;
The preceding statements produce this graph:
Part 2: Fitting multiple distributions to a single variable
In PROC UNIVARIATE and PROC CAPABILITY, you can specify more than one distribution option in any plotting statement, but the distributions must be from different families. That is, you can plot both a normal curve and a lognormal curve on the same graph, but you cannot plot two different normal curves. To display multiple curves from the same family using these procedures, you can again use PROC GREPLAY to produce an overlay effect by replaying multiple graphs in the same template. SAS 9.2 adds the ability to plot multiple distributions from the same family on one graph using PROC SGPLOT. Side-by-side histograms that use the same axes are available in PROC GCHART, but there are no options for displaying theoretical distributions.
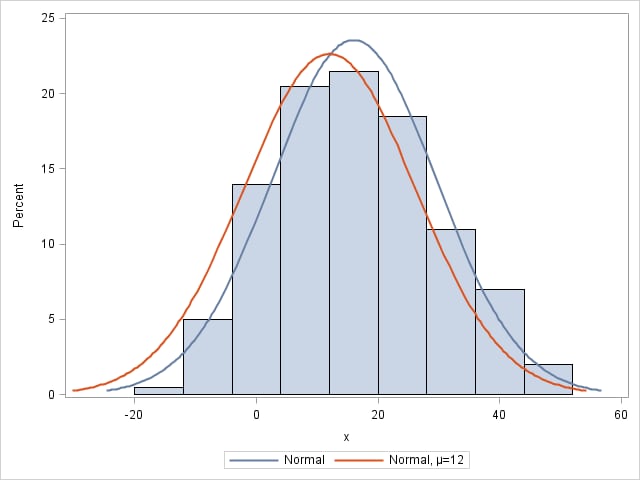
Overlaid Plots using PROC SGPLOT
With PROC SGPLOT, you can specify multiple HISTOGRAM and DENSITY statements to create overlay plots.
histogram x;
density x /type=normal;
density x /type=normal(mu=12);
run;
The preceding statements produce this graph:
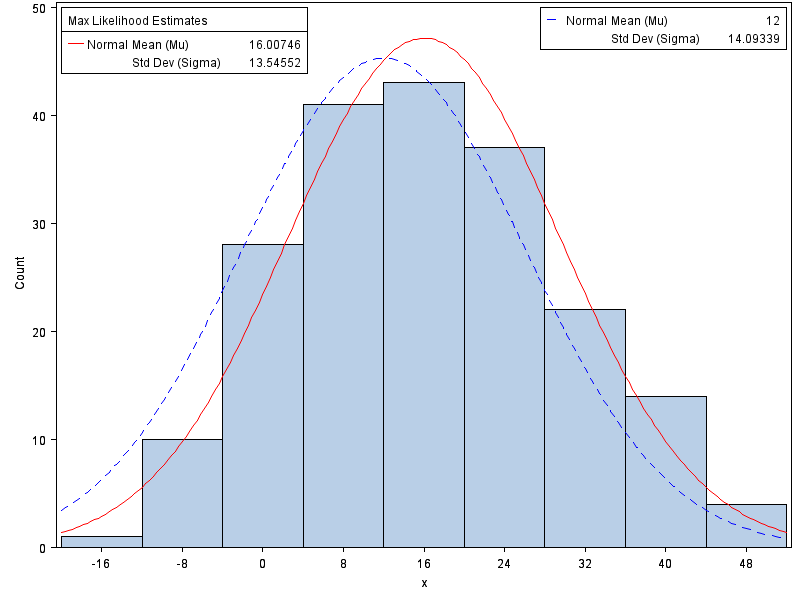
Overlaid Plots using PROC GREPLAY
Run the plots separately and store them in a graphics catalog. ODS Graphics must be disabled. Use AXIS options if necessary to ensure the same scaling on each plot. You can use the NODISPLAY option in a GOPTIONS statement to suppress the individual histograms from being displayed. The DISPLAY graphics option prior to PROC GREPLAY displays only the template of graphs.
ods graphics off;
proc univariate data=test noprint;
var x;
histogram x / normal(noprint color=red)
name='ML'
vscale=count
height=2;
inset normal(mu sigma) / pos=nw header='Max Likelihood Estimates' height=2;
run;
quit;
proc univariate data=test noprint;
var x;
histogram x / normal(mu=12 noprint color=blue l=20)
name='MU'
nobars
vscale=count
height=2;
inset normal(mu sigma) / pos=ne header=' ' height=2;
run;
quit;
/* Replay the two graphs into the same template */
goptions display;
proc greplay igout=work.gseg nofs tc=sashelp.templt template=whole;
treplay 1:ML 1:MU;
run;
ods graphics on;
The preceding statements produce this graph:
Operating System and Release Information
| Product Family | Product | System | SAS Release | |
| Reported | Fixed* | |||
| SAS System | SAS/STAT | All | n/a | |
| SAS System | Base SAS | All | n/a | |
| SAS System | SAS/QC | All | n/a | |
| Type: | Usage Note |
| Priority: | low |
| Topic: | SAS Reference ==> Procedures ==> UNIVARIATE SAS Reference ==> Procedures ==> CAPABILITY Analytics ==> Distribution Analysis SAS Reference ==> Procedures ==> SGPLOT |
| Date Modified: | 2019-01-29 10:30:39 |
| Date Created: | 2005-06-14 12:30:03 |