Note: Do not include calculated rows, such as the following row, in the report hierarchy table:

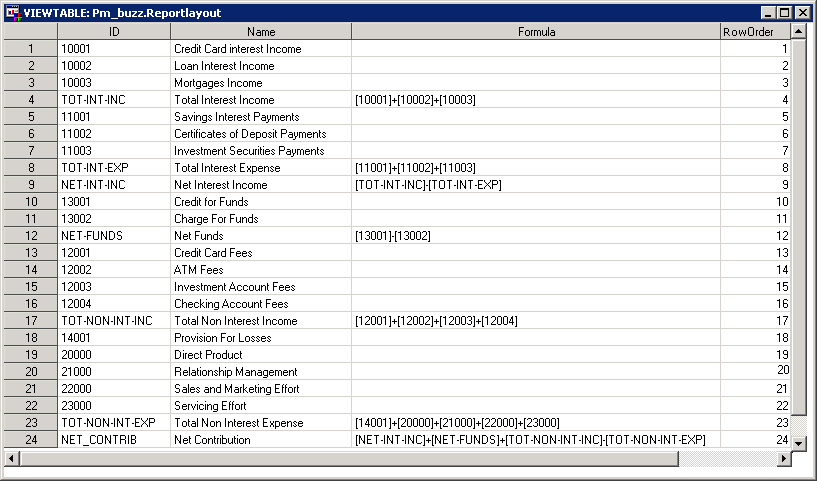
The report layout controls how the OLAP viewer displays the cube when it is first opened. You can see in the following graphic that the report layout table controls
- the order in which columns are displayed. REPORTLAYOUT causes income variables display before expense variables.
- whether fields are initially displayed expanded or collapsed. You can see in the following graphic that the Servicing Effort field is displayed collapsed because it is included in REPORTLAYOUT without any of its children showing. By contrast, the Interest Income field is displayed expanded to level 2 because its children (credit card interest income, loan interest income, mortgage income) are included in REPORTLAYOUT but not the parent Interest Income.
- totals. For example, line 4 of the report layout displays a total whose formula is: [10001]+[10002]+[10003] that is line 1 + line 2 + line 3.
Note: The OLAP viewer always shows the highest level of a dimension. The report layout determines to what level the highest dimension is expanded when the report is initially opened. A user can navigate the dimension, expanding and collapsing it at will.

See also: