The report hierarchy table defines the dimension hierarchy for drilling down into the profit-and-loss report. The number of levels in the hierarchy is a critical decision in model design and is subject to the ultimate reporting needs of the business managers to make decisions. The report hierarchy contains the following columns and must conform to the following rules:
Position |
Name | Maximum Length | Description |
1 |
ID | Char 32 | The identifying reference for the behavior |
2 |
L1_Profit | Char 32 | Top-level dimension members for the hierarchy |
3 |
L2_Profit | Char 32 | Second-level dimension members for the hierarchy |
4 |
L3_Profit | Char 32 | Third-level dimension members for the hierarchy |
5 |
L4_Profit | Char 32 | Fourth-level dimension members for the hierarchy |
6 |
L5_Profit | Char 32 | Fifth-level dimension members for the hierarchy |
The following picture shows a sample report hierarchy table:

Note: Do not include calculated rows from the report layout table, such as the following row, in the report hierarchy table:

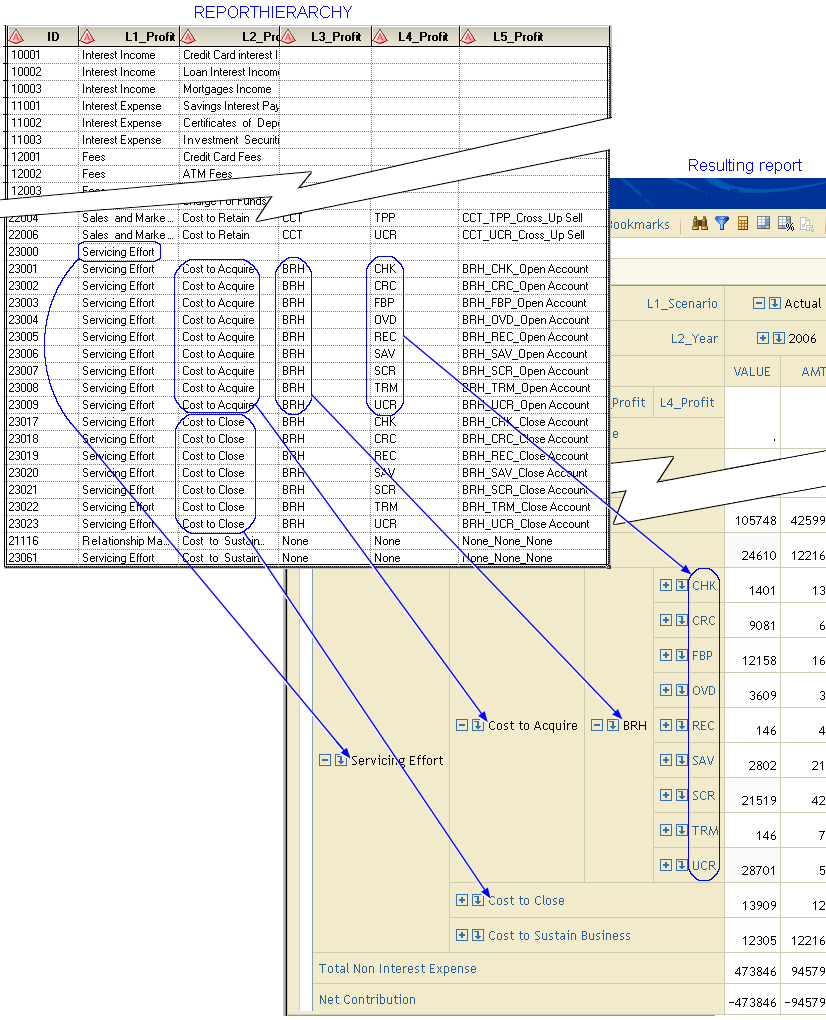
The following picture shows the relationship between this sample report hierarchy table and the resulting profit-and-loss report:

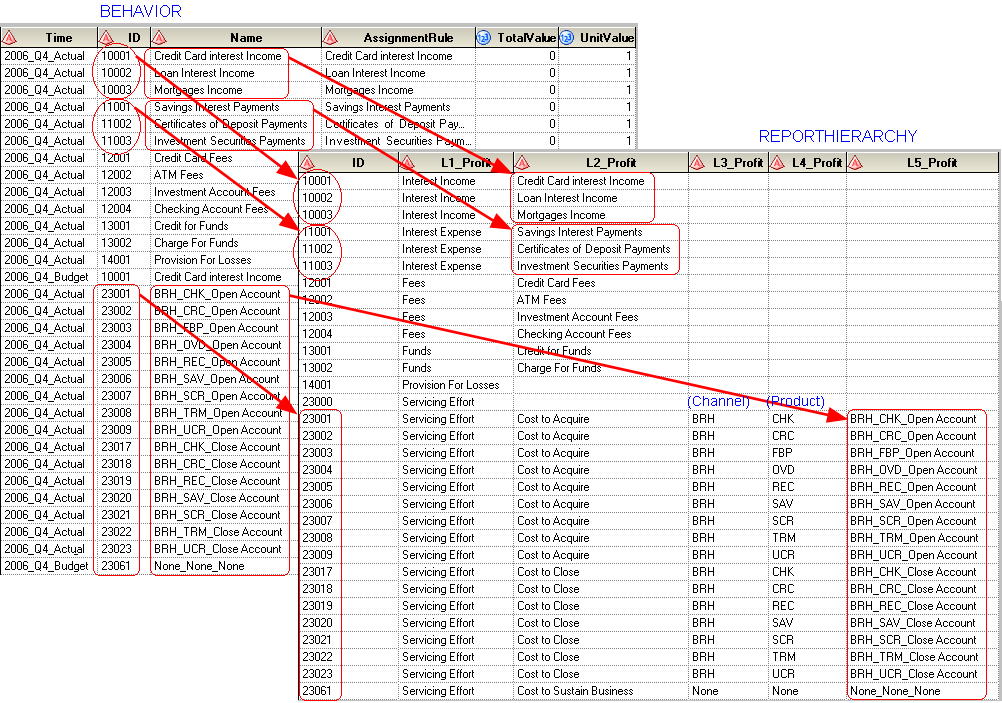
The following graphic illustrates the relationship between the behavior table and report hierarchy. In it, you can see that items in the behavior table occur at the lowest level in the report hierarchy table. Because the hierarchy can have different depths at different places, this means that the behavior table items can occur in different columns (different depths) in the report hierarchy table. Also, note that intermediate levels can correspond to custom dimensions (for example, the channel and product dimensions at levels 3 and 4) but they do not have to. For example, interest income and interest expense (in the first six rows of the report hierarchy table) have no existence outside the report hierarchy table itself.
