You are here: Folders Riser Bar>Maintaining Profiles>Preparing a Profile Report

DataFlux Data Management Studio 2.5: User Guide

Preparing a Profile Report

Overview

You can prepare or modify a profile report that will help you understand your data.

Use the Properties tab to create a profile report that is useful for planning. Perform the following tasks:

Select Tables and Fields

You can select tables and fields on the Properties tab of a profile. Perform the following steps:

  1. Open the connections that contain the tables that you want to include in the profile report in the data connections tree on the left-hand side of the Properties tab.
  2. Select the check boxes next to the tables that you want. Note that you can also right-click a table or connection to filter it or run an SQL query on it. You can even right-click Text Files and prepare a text file for use in the profile report.
  3. Click each selected table and review the included fields. You can remove a field that you do not need in the profile by deselecting the check box next to the field, as shown in the following display:

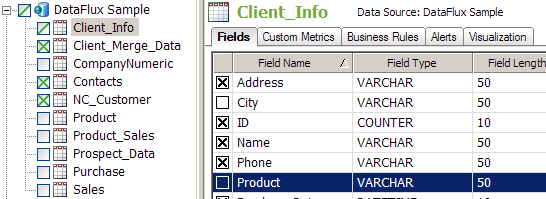
    Note that the check box next to the Client_Info table in the data connections tree now contains a slash instead of the letter X. The slash tells you that only some of the fields in the table are included in the profile report.

Edit Default Metrics

You can either accept the default metrics applied to all of the fields in the tables that you include or change some of these defaults. Perform the following steps to edit the default metrics:

  1. Click Default Profile Metrics in the Tools menu to access the Metrics dialog.
  2. Change the default metrics as needed. The dialog is shown in the following display:

  3. Click OK to save the metrics set for all fields.

Override Metrics

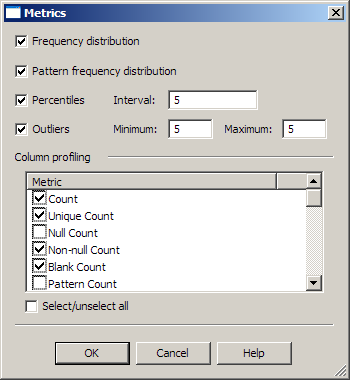
If you need to, you can override the metrics for one or more of your selected fields. Perform the following steps if you need to override the default metrics for any of your fields:

  1. Click a table in the data connections tree to open in it on the right-hand side of the Properties tab.
  2. Click the Fields tab to display the fields list.
  3. Right-click one or more rows in the fields list to display the Metrics dialog for the selected fields.
  4. Select or deselect any of the metrics in the dialog. Note that the metrics that use the frequency distribution metric (percentile, median, primary key candidate, mode, unique count, and unique percentage) are source-intensive and can degrade performance. However, you must enable frequency distribution for any field that you intend to use in a redundant data analysis, a data analysis, or a data quality monitoring report.
  5. Then, click OK to save your selections.
  6. If you ever need to edit or delete a set of saved overrides, you can right-click the field and select the appropriate option in the pop-up menu.

Apply Custom Metrics

You can also apply custom metrics to the profile. Custom metrics enable you to perform an evaluation or calculation that is not included in the standard metrics for a selected field. Perform the following steps:

  1. Click Custom Metrics on the Properties tab.
  2. Click the table that you want to associate with a custom metric.
  3. Click Add in the Custom Metrics tab to access the Custom Metrics Properties dialog.
  4. Select a custom metric from the drop-down menu in the Custom metric field. For example, you can select the Average NC Sales Value custom metric, which calculates the average value for a sales field in all of the records from a particular state.
  5. Review the inputs for the metric. Note that you can also add and delete outputs. The following display shows the properties for this custom metric:

  6. Click OK to apply the custom metric.

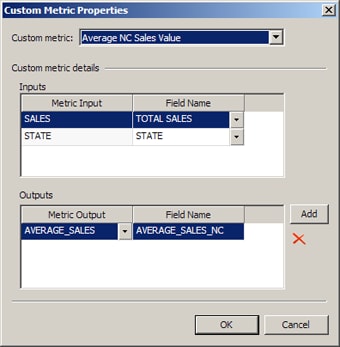
These steps describe how to apply a custom metric that has already been created. For more information about the sample metric, see Creating a Custom Metric That Performs a Calculation.

Apply Business Rules

You can apply business rules. These rules can help you monitor your data (sometimes in combination with custom metrics and alerts). For example, they can enable you to identify a set of related records in a table. This can be useful when the records are either not identified by the standard analysis provided in a profile or not conveniently presented. You can also use a business rule to select a particular set of records that will be useful in more than one profile. Perform the following steps:

  1. Click Business Rules on the Properties tab.
  2. Click the table that you want to associate with a business rule. For example, you could select the CompanyNumeric table in the DataFlux Sample repository.
  3. Click Add in the Business Rules tab to access the Business Rules Properties dialog.
  4. Select a business rule from the drop-down menu in the Business Rules tab. For example, you could select a rule called ProfitEmp_LessThan_Assets. This rule would log any table row where the amount in the Profit Per Employee field is less than the amount in the Assets field.
  5. Review the inputs for the business rule. Map the field aliases in the rule to fields in the selected table. For example, you could map the field alias Profit Per Employee to the profit/emp field in the CompanyNumeric table, as shown in the next display.

  6. Review the controls that enable you to log any data that violates the rule and specify the maximum number of rows to log. Set these controls as appropriate.
  7. Click OK to apply the rule. Note that you can edit and delete existing business rules.

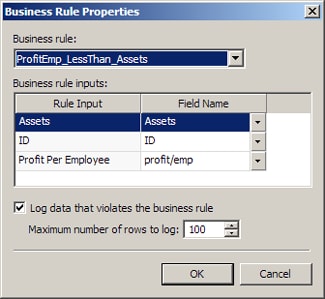
These steps describe how to apply a rule that has already been created. For more information about the example rule, see Creating a Rule that Compares Two Fields.

Apply Alerts

You can apply alerts that can help you monitor your data. These alerts are triggered by standard metrics, custom metrics, and business rules. Perform the following steps:

  1. Click Alerts.
  2. Click one of the tables that you have included in your profile.
  3. Click Add in the Alerts tab to access the Add Alert dialog.
  4. Specify the alert type. For this example, specify Business Rule.
  5. Click Continue.
  6. Configure the alert. In this case, you want to generate an alert whenever the failed row count for the ProfitEmp_LessThan_Assets business rule exceeds five rows, as shown in the following display:

  7. Click OK to apply the rule. Note that you can edit and delete existing alerts.

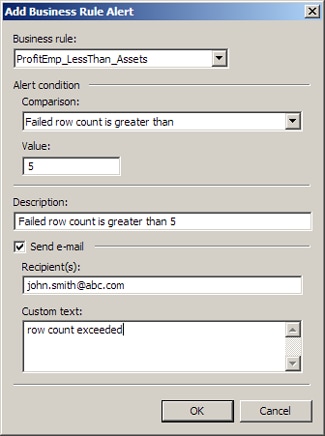
If the alert condition is satisfied and the alert is triggered, an alert icon will be displayed on the table name and the field name in the Report tab. In addition, the triggered alert will be listed on the Alerts tab in the Report tab. If you select Send e-mail, you will receive an e-mail when the alert is triggered. For the e-mail feature to work, you must update the emailcmd path in the app.cfg file for your DataFlux Data Management Studio implementation to point to your mail server.

Add Visualizations

You can also add a visualization to the profile reports. Visualizations are customized charts that you create based on your data and the metrics that you apply. Perform the following steps:

  1. Click the Visualization tab. Then click Add to access the Chart Properties dialog.
  2. Enter a description of the chart.
  3. Specify a chart type.
  4. Specify the fields and metrics that you want to chart, as shown in the following display:

  5. Click OK.

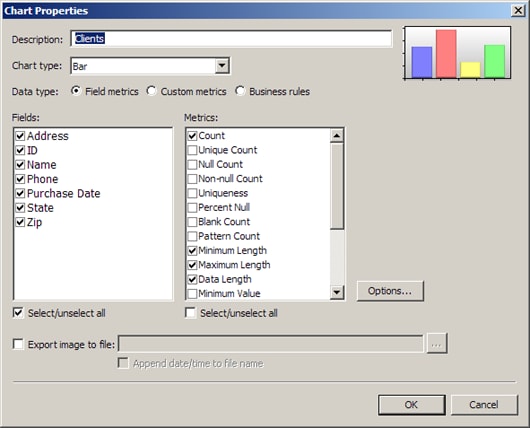
You will be able see this chart on the Report tab after you run the profile report. Note that you can also create visualizations on the Report tab.

Run the Profile Report

You must run the profile report whenever you change any of its properties. Perform the following steps:

  1. Click Run in the toolbar to access the Run Profile dialog.
  2. Enter a description of the run in the Description field.
  3. Determine whether you want to append the report to the list of existing reports that drops down from the toolbar. If you select the Append to existing report check box, the report is added to the list. If you deselect the check box, the existing reports in the list are overwritten by the new report.
  4. Determine whether you want to enter macros and macro values by clicking Macro Variables.

Profiles can also be executed from the command line, as described in Running Jobs from the Command Line.

Note that you can now run multiple profiles in the same repository if the appropriate commit options are set for the profiles in the General tab of the Options dialog for profiles. If the commit option is set to the default value of Commit all rows in a single transaction, then no other client or server accessing the same repository will be able to execute a profile until the first profile is finished. If the commit option is set to Commit every row or Commit every X rows, then you can run multiple profiles in the same repository simultaneously. For general information about profile options, see Options Dialog.

Add a Note to a Profile Report

You can add a note to a specific profile report. This note is attached to only this profile report instance. It is not displayed in any other instance of a profile report. For example, imagine a profile report that is maintained by two business users. User One could create the report. One month later, User Two could modify the report and add text to the Notes section that describes the changes. This note would be logged as metadata along with the profile report. However, it would not be associated with the underlying profile or with any other profile report instance.

Perform the following steps:

  1. Click the Notes sub-tab.
  2. Right-click in the sub-tab and select New Note from the pop-up menu.
  3. Enter the text of your note into the Add Note dialog.
  4. Click OK to save the note.

Documentation Feedback: yourturn@sas.com
Note: Always include the Doc ID when providing documentation feedback.

Doc ID: dfU_T_ProfileConfig.html