New Output Defaults in SAS 9.3
Overview
In SAS 9.3, output in
the SAS windowing environment is created by default in HTML. In addition,
ODS Graphics is enabled by default. The following sections explain
the advantages of these new defaults and how to change the defaults
to match those of previous releases:
LISTING output is the
default in previous releases and when you run SAS in batch mode in
SAS 9.3. HTML output in the SAS windowing environment is the default
in SAS 9.3 for Microsoft Windows and UNIX, but not for other operating
systems. Your actual defaults might be different because of your registry
or configuration file settings.
HTML Output in the SAS Windowing Environment
In SAS 9.3, the default
destination in the SAS windowing environment is HTML, and ODS Graphics
is enabled by default. These new defaults have several advantages.
Graphs are integrated with tables, and all output is displayed in
the same HTML file using a new style. This new style, HTMLBlue, is
an all-color style that is designed to integrate tables and modern
statistical graphics.
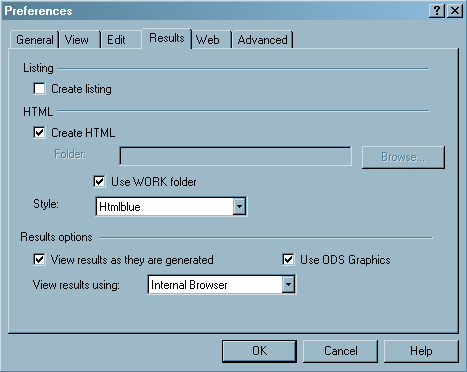
You can view and modify
the default settings by selecting Tools OptionsPreferences from the menu at the top of the main SAS window.
Then open the Results tab. You can remember
this sequence using the mnemonic TOPR (pronounced “topper”).
The following display shows the SAS Results tab with the new default settings specified:
OptionsPreferences from the menu at the top of the main SAS window.
Then open the Results tab. You can remember
this sequence using the mnemonic TOPR (pronounced “topper”).
The following display shows the SAS Results tab with the new default settings specified:
In many cases, graphs
are an integral part of a data analysis. However, when you run large
computational programs (such as when you use procedures with many
BY groups) you might not want to create graphs. In those cases, you
should disable ODS Graphics, which will improve the performance of
your program. You can disable and re-enable ODS Graphics in your SAS
programs with the ODS GRAPHICS OFF and ODS GRAPHICS ON statements.
You can also change the ODS Graphics default in the Results tab.
LISTING Output in the SAS Windowing Environment
Before SAS 9.3, SAS
output in the SAS windowing environment was created by default in
the LISTING destination. In the LISTING destination, tables are displayed
in monospace, and graphs are not integrated with tables.
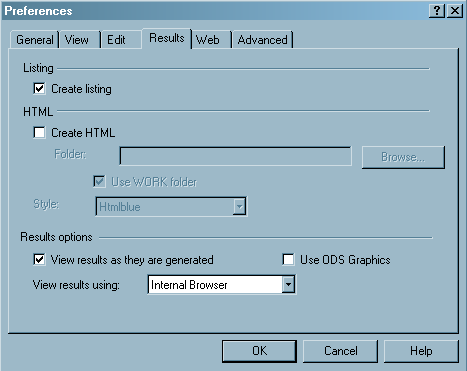
You can create LISTING
output by selecting ToolsOptionsPreferences from the menu at the top of the main SAS window.
Then open the Results tab. Select the Create listing check box, and do not select the Create HTML check box.
Before SAS 9.3, ODS
Graphics was disabled by default. You can enable or disable ODS Graphics
by default by using the check box, and you can use the ODS GRAPHICS
ON and ODS GRAPHICS OFF statements to enable and disable ODS Graphics
in your SAS programs. The following display shows the SAS Results tab with the old default settings specified: