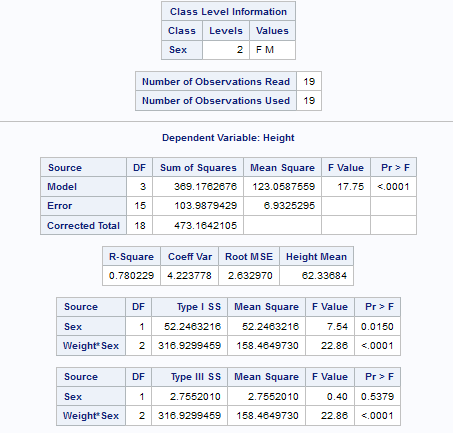
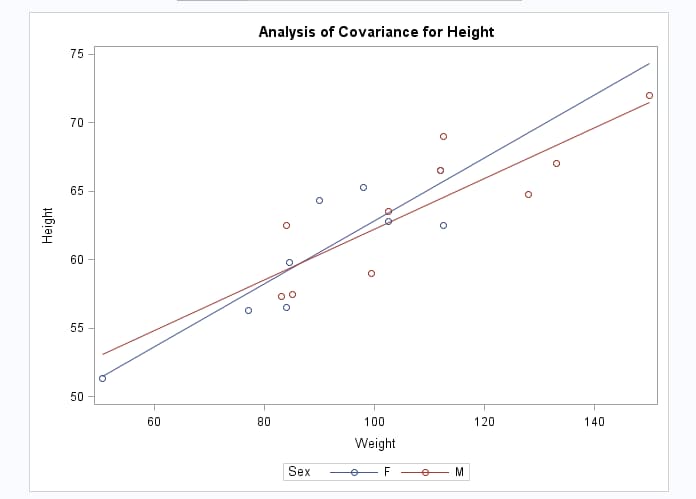
Analysis of Covariance Task

Assigning Data to Roles
To run the Analysis
of Covariance task, you must assign columns to the Dependent
variable, Categorical variable,
and Continuous covariate roles.
|
Role
|
Description
|
|---|---|
|
Dependent
variable
|
specifies a continuous
numeric variable.
|
|
Categorical
variable
|
specifies a character
or numeric variable that specifies the levels of the groups.
|
|
Continuous
covariate
|
specifies a continuous
numeric variable that is related to the dependent variable. You can
specify whether to center the covariate variable.
|
Setting Options
|
Option
|
Description
|
|---|---|
|
Model
|
|
|
Intercepts
|
specifies whether to
use the equal or unequal intercepts for each level of the categorical
variable.
|
|
Slopes
|
specifies whether to
use the equal or unequal slopes for each level of the categorical
variable.
|
|
Show parameter
estimates
|
produces a solution
to the normal equations (parameter estimates). By default, the task
displays a solution if your model does not include any classification
variables. Select this option only if you want to see the solution
for models with classification effects.
|
|
Multiple Comparisons
|
|
|
Perform
multiple comparisons
|
performs the least squares
means for the categorical variable.
|
|
Covariate
value
|
specifies the value
to use in multiple comparisons. The covariate value can be either
the mean value or a specified value.
|
|
Method
|
requests a multiple
comparison adjustment for the p-values and
confidence limits for the differences of LS-means.
Here are the available
methods:
|
|
Significance
level
|
specifies the significance
level for the comparisons. The default is 0.05.
|
|
Plots
|
|
|
You can choose to display
only the default plots in your output, select the plots to display
in the output, or display no plots in the output. The list of available
plots depends on the method that you selected for multiple comparisons.
|
|
Copyright © SAS Institute Inc. All rights reserved.