One-Way ANOVA Task

About the One-Way ANOVA Task

A one-way analysis of variance (ANOVA) considers one treatment factor with two or more treatment levels. The goal of the analysis is to test for differences among the means of the levels and to quantify these differences. If there are two treatment levels, then this analysis is equivalent to a t-test that compares two group means.
You might use the One-Way ANOVA task to do the following:
  • study the effect of bacteria on the nitrogen content of red clover plants. The factor is the bacteria strain, and it has six levels.
  • compare the life spans of three different brands of batteries. The factor is the brand, and it has three levels.

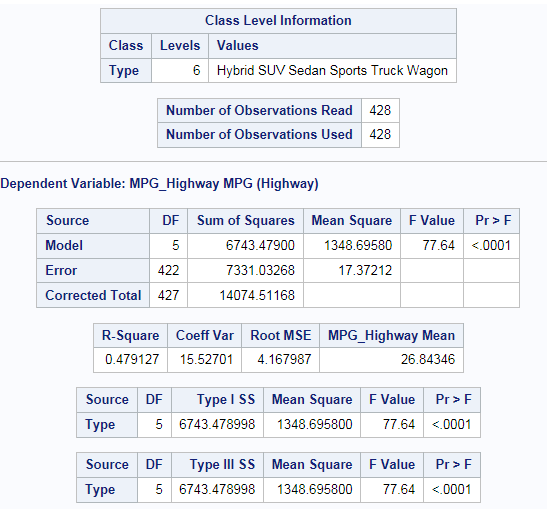
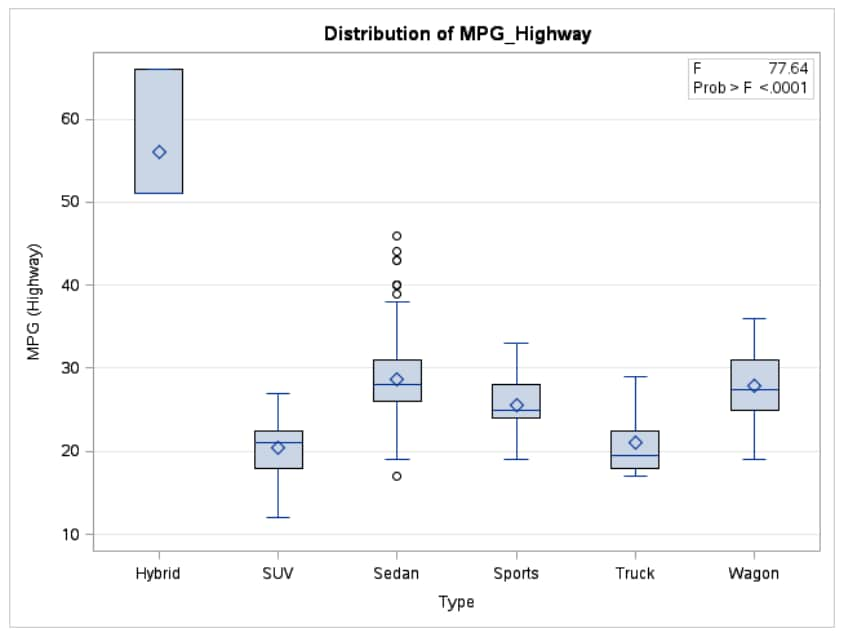
Example: Testing for Differences in the Means for MPG_Highway by Car Type

In this example, you want to study the differences in the means for the number of highway miles per gallon for six car types.
To create this example:
  1. In the Tasks section, expand the Statistics folder and double-click One-Way ANOVA. The user interface for the One-Way ANOVA task opens.
  2. On the Data tab, select the SASHELP.CARS data set.
  3. Assign columns to these roles:
    Role
    Column Name
    Dependent variable
    MPG_Highway
    Explanatory variable
    Type
  4. To run the task, click Submit SAS code.
Here is a subset of the results:
Example of Tabular Output
Distribution of MPG_Highway

Assigning Data to Roles

To run the One-Way ANOVA task, you must assign columns to these roles:
Role Name
Description
Dependent variable
specifies a continuous numeric column.
Explanatory variable
specifies a character or numeric column with values that specify the levels of the groups. The column that you assign to this role must have two or more distinct values.

Setting Options

Option Name
Description
Normality Assumption
Tests for normality
runs tests for normality that include a series of goodness-of-fit tests based on the empirical distribution function. The table provides test statistics and p-values for the Shapiro-Wilk test (provided the sample size is less than or equal to 2,000), the Kolmogorov-Smirnov test, the Anderson-Darling test, and the Cramér-von Mises test.
Homogeneity of Variance
Test
specifies the type of test to perform. Here are the valid values:
None
specifies that no test is performed.
Bartlett
computes accurate Type I error rates when the distribution of the data is normal.
Test (continued)
Brown & Forsythe
is a variation of Levene's test. Equal variances are determined by using the absolute deviations from the group medians. Although this is a good test for determining variance differences, it can be resource intensive if your data contains several large groups.
Levene
computes the squared residuals to determine equal variance. Levene’s test is considered to be the standard homogeneity of variance test. This is the default.
O’Brien
specifies O’Brien’s test, which is a modification of Levene’s test that uses squared residuals.
Welch’s variance-weighted ANOVA
tests the group means using a weighted variance. You can use this test if the assumption of equal variances is rejected.
Comparisons
You can select from these comparison methods:
Bonferroni
performs Bonferroni t tests of differences between means for all means of the main effect.
Duncan multiple range
performs Duncan’s multiple range test on all means of the main effect.
Gabriel
performs Gabriel’s multiple-comparison procedure on all means of the main effect.
Nelson
analyzes all the differences with the least squares means.
Ryan-Einot-Gabriel-Welsch
performs the Ryan-Einot-Gabriel-Welsch multiple range test on all means of the main effect.
Scheffé
performs Scheffé’s multiple-comparison procedure on all means of the main effect.
Sidak
performs pairwise t tests on differences between means with levels adjusted according to Sidak’s inequality for all means of the main effect.
Student-Newman-Keuls
performs the Student-Newman-Keuls multiple range test on all main effect means.
Least significant difference (LSD)
performs pairwise t tests for all means of the main effect. In the case of equal cell sizes, this test is equivalent to Fisher’s least significant difference test.
Tukey
performs Tukey’s studentized range test (HSD) on all means of the main effect. When the group sizes are different, this is the Tukey-Kramer test.
You can also specify the level of significance for the selected test.
Plots
By default, the results include a box plot, a means plot, and a mean difference plot. You can also specify to include any diagnostic plots, which can be displayed in a panel or as individual plots.
You can also specify the maximum number of points to include in these plots.