Panel Data: Count Data Regression Task

About the Panel Data: Count Data Regression Task

The Panel Data: Count Data Regression task analyzes regression models for panel data in which the dependent variable is a nonnegative integer or count values. This task fits a one-way model where the cross-sectional effect is modeled in the error term.
Note: This task is available only if you are running the first maintenance release for SAS 9.4, which includes SAS/ETS 13.1.

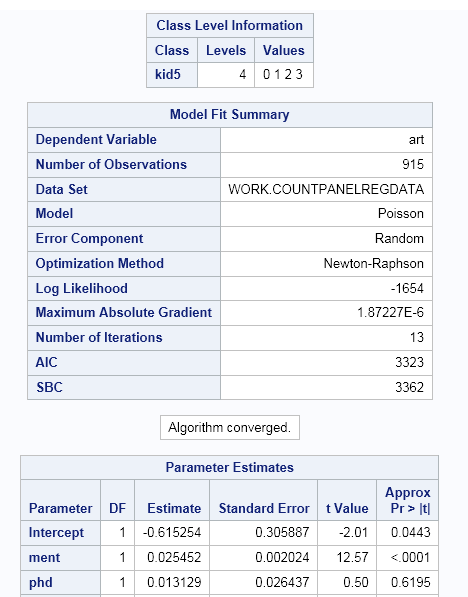
Example: Count Data Regression with Panel Data

To create this example:
  1. Create the WORK.LONG97DATA data set. For more information, see LONG97DATA Data Set.
  2. In the Tasks section, expand the Econometrics folder and double-click Panel Data: Count Data Regression. The user interface for the Panel Data: Count Data Regression task opens.
  3. On the Data tab, select the WORK.LONG97DATA data set.
  4. Assign columns to these roles:
    Role
    Column Name
    Dependent variable
    art
    Continuous variables
    ment
    phd
    mar
    Categorical variables
    kid5
    Cross-sectional ID
    fem
  5. To run the task, click Submit SAS code.
Here is a subset of the results:
Results from the Panel Data: Count Data Regression Task

Assigning Data to Roles

To run the Count Panel Data Regression task, you must assign columns to the Dependent variable and Cross-sectional ID roles.
Role
Description
Dependent variable
specifies the numeric column that has nonnegative integer or count values.
The Distribution option specifies the type of model to be analyzed. You can specify these types of models:
  • Poisson regression model
  • negative binomial regression model with a linear variance function
  • negative binomial regression model with a quadratic variance function
Continuous variables
specifies the independent covariates (regressors) for the regression model. If you do not specify a continuous variable, the task fits a model that contains only an intercept.
Categorical variables
specifies the variables to use to group data in the analysis.
Cross-sectional ID
specifies the cross-section for each observation. You can specify whether the error component model is fixed or random.

Setting Options

Option
Description
Methods
Type of covariances of the parameter estimates
specifies the type of covariance matrix of the parameter estimates.
You can specify these types of matrices:
  • the covariance from the inverse Hessian matrix
  • the covariance from the outer product mix
  • the covariance from the outer product and Hessian matrices (also called the quasi-maximum-likelihood-estimates)
Include the intercept in the model
specifies whether to include the intercept in the model.
Optimization
Method
specifies the iterative minimization method to use. You can specify the maximum number of iterations to perform for the selected method.
Plots
Diagnostic Plots
Profile likelihood plot
produces the profile likelihood functions of the model parameters. The model parameter on the X axis is varied, whereas all other parameters are fixed at their estimated maximum likelihood estimates.
Overdispersion diagnostic plot
produces the overdispersion diagnostic plot.
Probability Plots
Specified count levels
supplies the values of the response variable for the overall predictive probabilities plot and the predictive probability profiles plot. Each value should be a nonnegative integer. Nonintegers are rounded to the nearest integer.
You can also specify a list in the form of X TO Y BY Z. For example, COUNTS(0 1 2 TO 10 BY 2 15) specifies to plot counts for 0, 1, 2, 4, 6, 8, 10, and 15.
Overall predictive probabilities plot
produces the overall predictive probabilities of the specified count levels.
Predictive probability profiles plot
produces the predictive probability profiles of specified count levels against model regressors. The regressor on the X axis is varied, whereas all other regressors are fixed at the mean of the observed data set.
Display plots
specifies whether to display the plots in a panel or individually.
Output Tables
You can specify whether to include any output tables in the results.
Here is the information that you can include in the results:
  • correlation matrix of the parameter estimates
  • covariance matrix of the parameter estimates
  • iteration history of the objective function and parameter estimates