|
|
|
|
|
|
|
Data correlation is
a statistical procedure for describing the relationship between numeric
variables. The relationship is described by calculating correlation
coefficients for the variables.
|
|
|
Regression analysis
is the analysis of the relationship between two or more quantitative
variables. This relationship is expressed through a statistical model
that predicts the dependent variable from a function of the explanatory
variables and parameters. A dependent variable is also called a response
variable. Explanatory variables can also be called independent variables,
predictors, or regressor variables.
For example, you might
use regression analysis to find out how well you can predict a child's
weight if you know the child's height. Suppose that a SAS data
set contains the height and weight measurements of 19 children. By
using weight as the dependent variable and height as the independent
variable, you can perform a linear regression analysis on this data.
|
|
|
A one-sample t test
compares the mean of the sample to a given number.
|
|
|
A two-sample t test
compares the mean of the first sample minus the mean of the second
sample to a given number.
|
|
|
A paired-sample t test
compares the mean of the differences in the observations to a given
number.
|
|
|
A one-way analysis of
variance (ANOVA) considers one treatment factor with two or more treatment
levels. The goal of the analysis is to test for differences among
the means of the levels and to quantify those differences. If there
are two treatment levels, then this analysis is equivalent to a t test
that compares two group means.
You might use ANOVA
to perform any of the following tasks. The three different types of
treatment are then randomly assigned within each block.
-
study the effect of bacteria on
the nitrogen content of red clover plants. The factor is the bacteria
strain, and it has six levels.
-
analyze a randomized complete block
design. For example, suppose that you are interested in whether three
different types of treatment have different effects on the yield and
worth of a particular crop. You believe that the experimental units
are not homogeneous, so you introduce a blocking factor that allows
the experimental units to be homogeneous within each block.
-
compare the life spans of three
different brands of batteries. The factor is the brand, and it has
three levels.
|
|
|
|
|
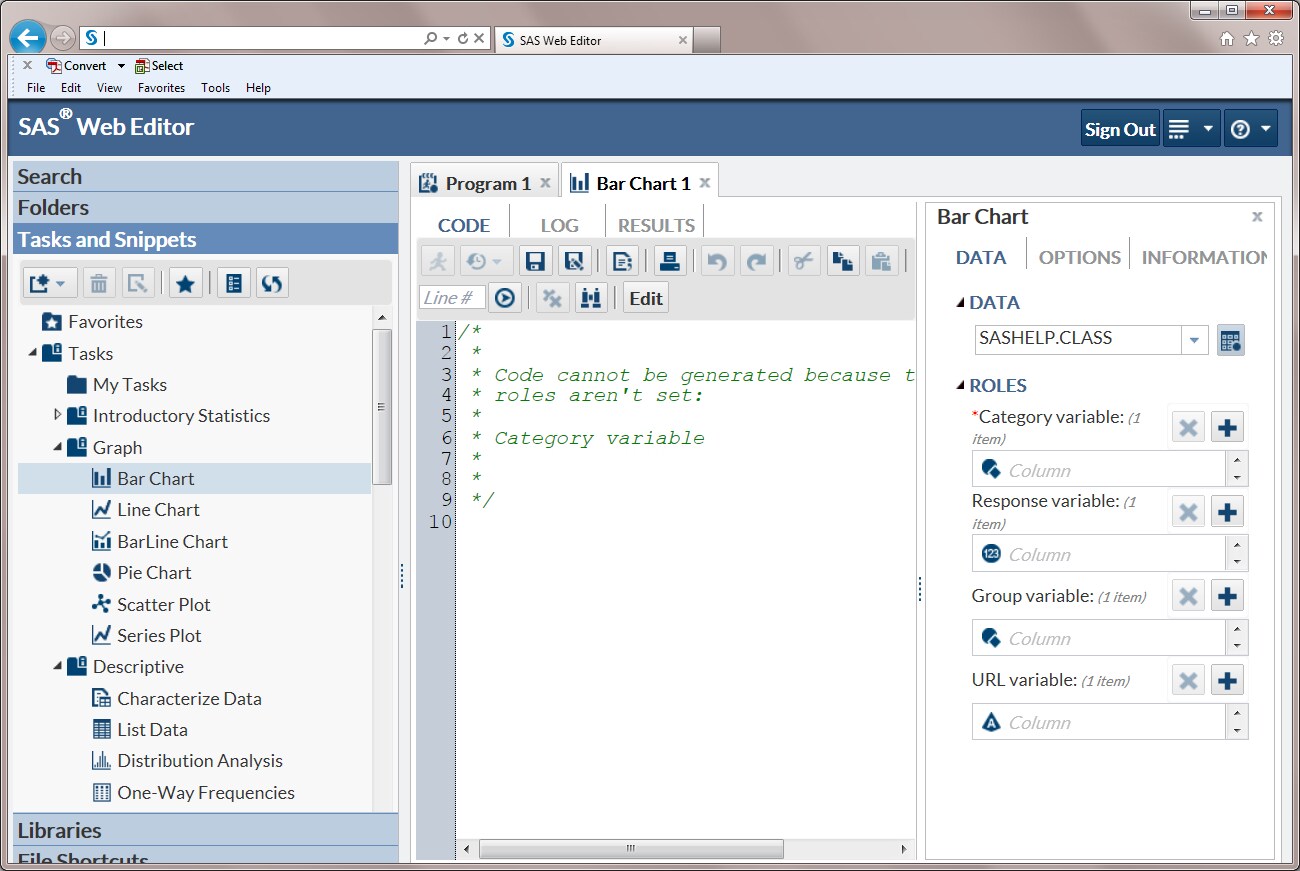
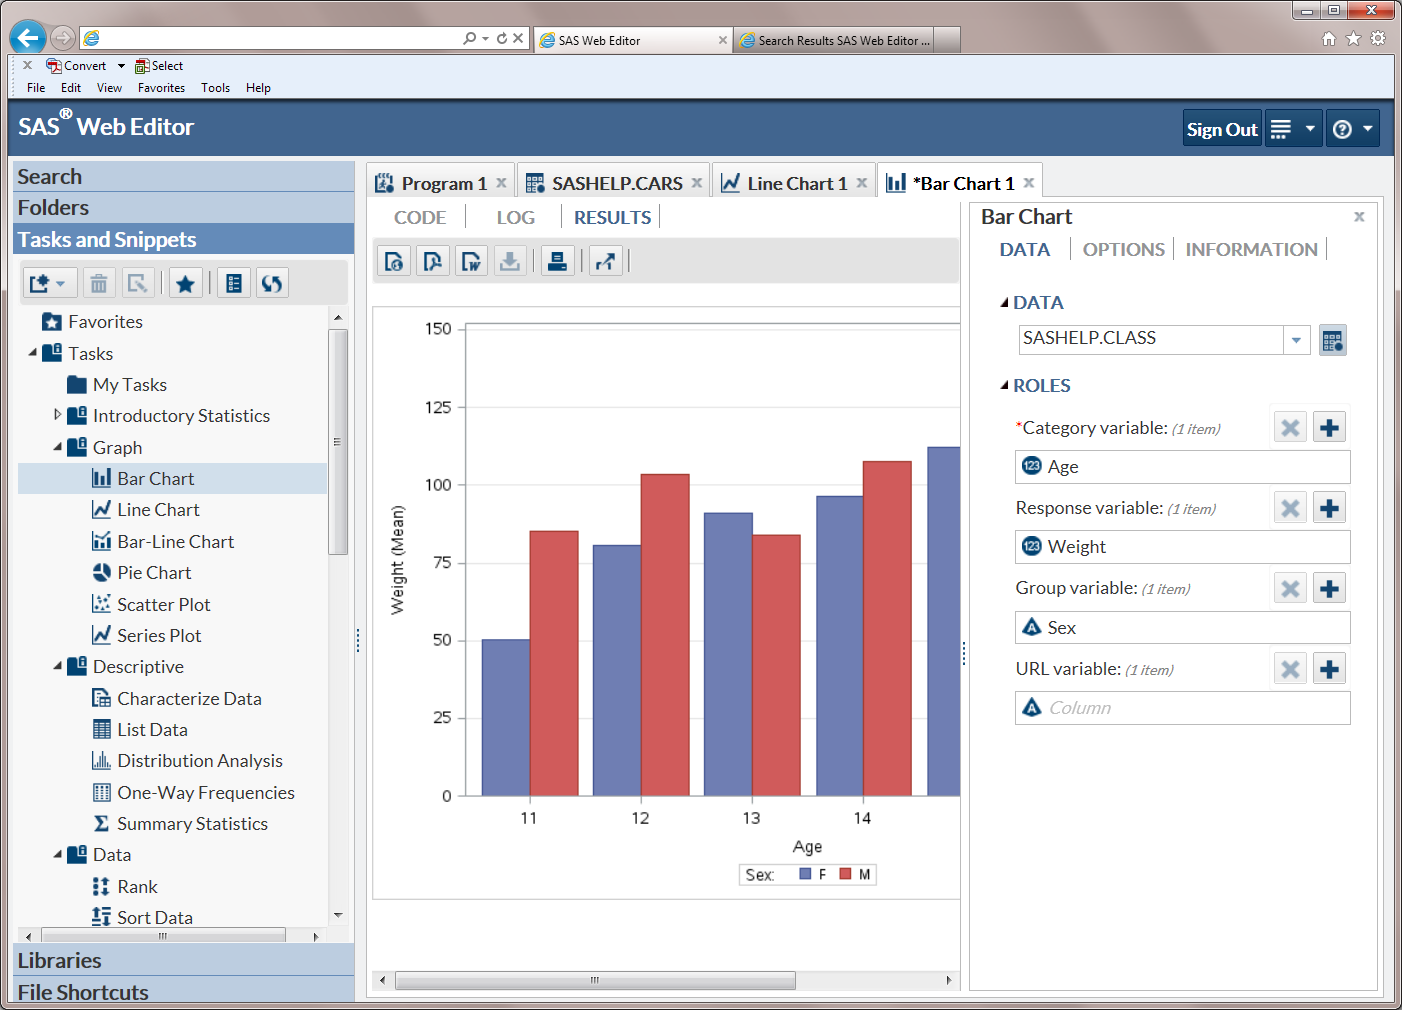
The Bar Chart task creates
horizontal or vertical bar charts that compare numeric values or statistics
between different values of a chart variable. Bar charts show the
relative magnitude of data by displaying bars of varying height. Each
bar represents a category of data.
You might use a bar
chart to compare the total amount of sales at each location of a store.
In this type of chart, each bar represents the total sales for each
site.
|
|
|
The Line Chart task
assumes that the values in the category variable are discrete. The
task groups these values into distinct categories. If a response variable
is assigned, you can select the statistic (either mean or sum) for
the response values. By default, the task calculates the mean of the
response values. If no response variable is assigned, a frequency
chart by category is created.
For example, a line
chart can compare the number of advertising campaigns across products.
|
|
|
The Bar-Line Chart task
creates a vertical bar chart with a line chart overlay.
You can use this task
to perform the following:
-
display and compare exact and relative
magnitudes
-
examine the contribution of each
part to the whole
-
determine trends and patterns in
the data
|
|
|
The Pie Chart task creates
pie charts that represent the relative contribution of the parts to
the whole by displaying data as wedge-shaped "slices" of
a circle. Each slice represents a category of data. The size of a
slice represents the contribution of the data to the total chart statistic.
For example, a pie
chart can show the sales of each store as a fraction of a chain's
total sales.
|
|
|
The Scatter Plot task
creates plots that show the relationships between two or three variables
by revealing patterns or concentrations of data points. For example,
a two-dimensional scatter plot can display the weights and ages of
all patients who are included in a clinical study.
|
|
|
The Series Plot task
creates a line plot. Series plots display a series of line segments
that connect observations of input data. For example, series plots
can be used to show stock trends.
|
|
|
|
|
The Characterize Data
task enables you to create a summary report, graphs, and frequency
and univariate SAS data sets that describe the main characteristics
of the data.
|
|
|
The List Data task displays
the contents of a table as a report.
For example, you can
use the List Data task to create a report that sums the expenses and
revenues for each sales region.
|
|
|
The Distribution Analysis
task provides data summarization tools as well as information about
the distribution of numeric variables. You can also use it to create
a variety of plots, including histograms, probability plots, quantile-quantile
plots, and box plots.
You might use this
task to create the summary statistics for a product. For example,
suppose that you have stored the loan-to-value ratios of 5,840 home
mortgages in a SAS data set. Using the Distribution Analysis task,
you could create the following output:
-
a table of summary measures, including
moment estimates, and a table of extreme observations.
-
a histogram that enables you to
visualize the distribution of loan-to-value ratios. The histogram
reveals features of the distribution, such as its skewness and the
peak.
-
an analysis of the distribution
of the data. This task enables you to run tests for normality and
create charts, such as a probability plot.
|
|
|
The One-Way Frequencies
task generates frequency tables from your data. You can also use it
to perform binomial and chi-square tests. You might want to use this
task to analyze the efficiency of a new drug. For example, suppose
that a group of medical researchers are interested in evaluating the
efficacy of a new treatment for a skin condition. Dermatologists from
participating clinics are trained to conduct the study and to evaluate
the condition. After the training, two dermatologists examine patients
with the skin condition from a pilot study and rate the same patients.
The One-Way Frequencies task can be used to evaluate the agreement
of the diagnoses.
|
|
|
The Summary Statistics
task provides data summarization tools to compute descriptive statistics
for variables across all observations and within groups of observations.
You can also summarize your data in a graphical display, such as a
histogram.
For example, you could
use this task to create a report on the number of new sales, arranged
by product type and country.
|
|
|
|
|
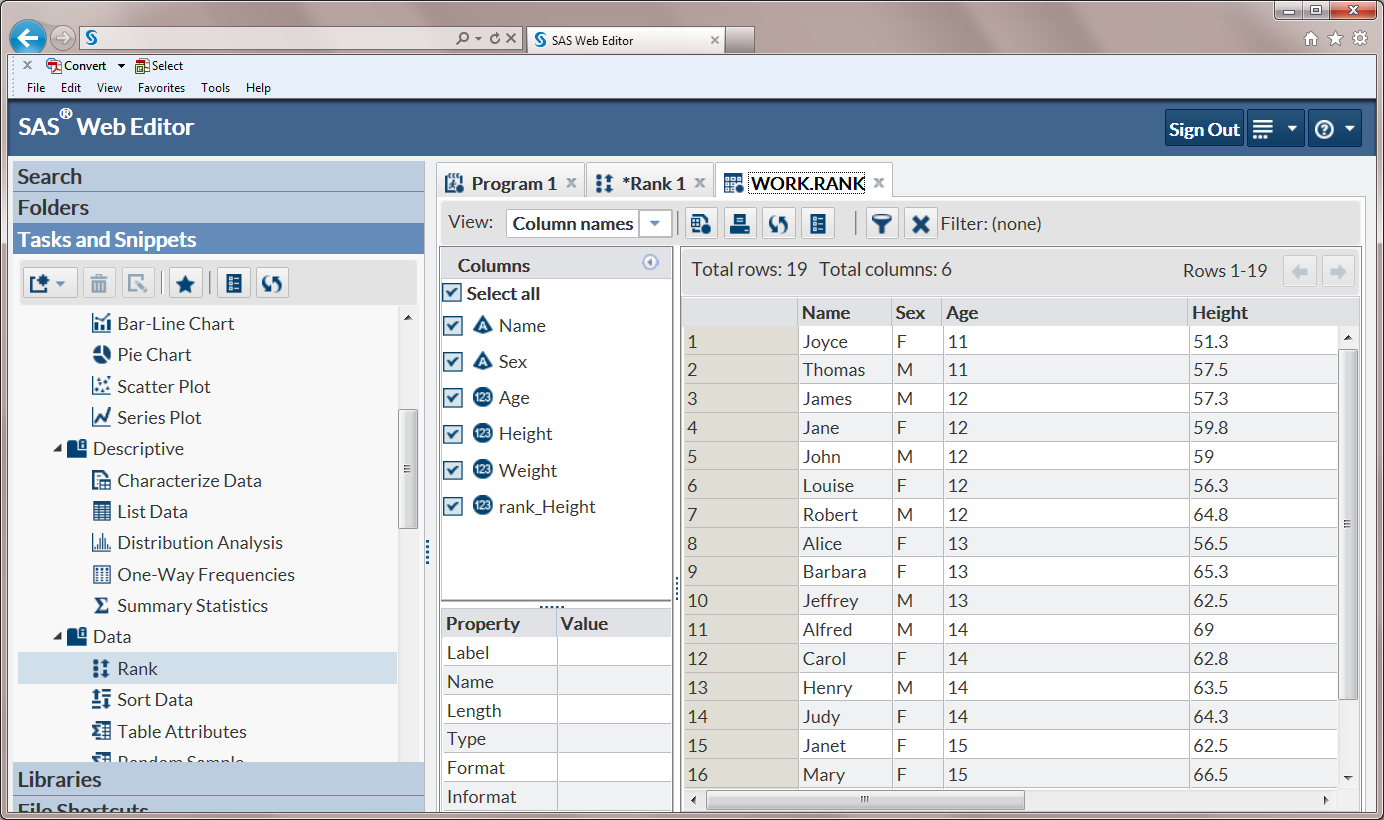
The Rank task computes
ranks for one or more numeric columns across the rows in a table.
The output displays the ranks in a new table.
For example, you might
want to rank the sales for each product that your company sells. In
this case, the ranking variable would show the order of product sales.
The product with the highest number of sales would be ranked first.
|
|
|
The Sort Data task enables
you to sort the table by any of its columns.
|
|
|
The Table Attributes
task enables you to create these types of reports:
-
a default report that includes
the following data attributes: the date on which the table was created
and last modified, the number of rows, the encoding, any engine or
host-dependent information, and an alphabetic list of the variables
and their attributes.
-
an enhanced report displays the
table and variable attributes. From this report, you can determine
the table type, the date on which the table was created and modified,
the number of observations, the variable labels, and the variable
types.
|
|
|
The Random Sample task
creates an output table that contains a random sample of the rows
in the input table.
You might use this task
when you need a subset of the data. For example, suppose that you
want to audit employee travel expenses in an effort to improve the
expense reporting procedure and possibly reduce expenses. Because
you do not have the resources to examine all expense reports, you
can use statistical sampling to objectively select expense reports
for audit.
|
|
|
The Transpose task turns
selected columns of an input table into the rows of an output table.
If you do not use grouping variables, then each selected column is
turned into a single row. If you use grouping variables, then the
selected columns are divided into subcolumns based on the values of
the grouping variables, and each subcolumn is turned into a row of
the output table.
|