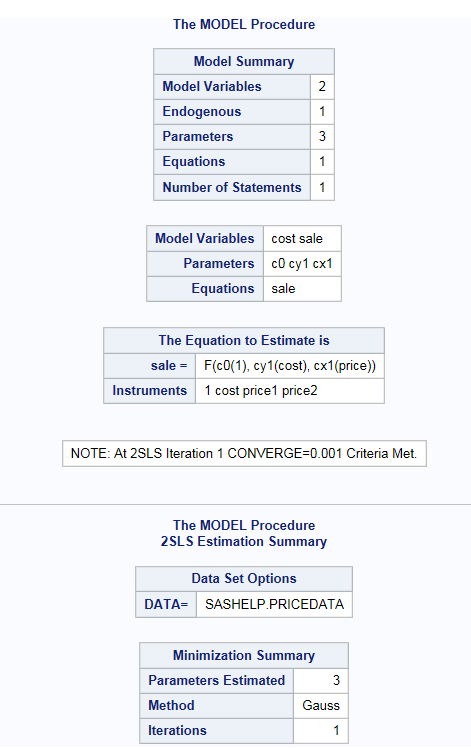
Two-Stage Least Squares
Example: Two-Stage Least Squares
To create this example:
-
TipIf the data set is not available from the drop-down list, click
 . In the Choose a Table window,
expand the library that contains the data set that you want to use.
Select the data set for the example and click OK.
The selected data set should now appear in the drop-down list.
. In the Choose a Table window,
expand the library that contains the data set that you want to use.
Select the data set for the example and click OK.
The selected data set should now appear in the drop-down list.

Assigning Data to Roles
To perform a two-stage
least squares analysis, you must assign an input data set. To filter the input data
source, click  .
.
.
You also must assign
variables to the Dependent variable, Exogenous
explanatory variables, Endogenous explanatory
variables, and Excluded instrumental variables roles.
The number of variables that you assign to the Excluded
instrumental variables role must be greater than or equal
to the number of endogenous explanatory variables.
|
Role
|
Description
|
|---|---|
|
Roles
|
|
|
Dependent
variable
|
specifies the dependent
variable for the equation. The equation is in this format:
 . .
In this equation:
|
|
Exogenous
explanatory variables
|
specifies a factor in
the model whose values are not determined by the states of other variables
in the system.
|
|
Endogenous
explanatory variables
|
specifies a factor in
the model whose values are determined by the states of other variables
in the system.
|
|
Excluded
instrumental variables
|
specifies the variables
not to include in the equation.
|
|
Additional Roles
|
|
|
Group analysis
by
|
enables you to obtain separate
analyses of observations for each unique group.
|
Setting Options
|
Option
|
Description
|
|---|---|
|
Methods
|
|
|
Optimization
method
|
specifies the optimization
method to use.
You can use the default
method, or you can choose from these methods:
|
|
Maximum
number of iterations
|
specifies the maximum
number of iterations for the selected method. You can use the default
value or specify a custom value.
|
|
Statistics
|
|
|
You can specify whether
the results include the statistics that the task creates by default,
the default statistics and any additional statistics that you select,
or no statistics.
Here are the additional
statistics that you can include in the results:
|
|
|
Plots
|
|
|
By default, a plot of
the predicted and actual values is included in the results. You can
choose to display all of the plots, selected additional plots, or
no plots.
You can include these
additional plots in the results:
|
|
Copyright © SAS Institute Inc. All rights reserved.