Heckman’s Two-Step Selection Method
About Heckman’s Two-Step Selection Method
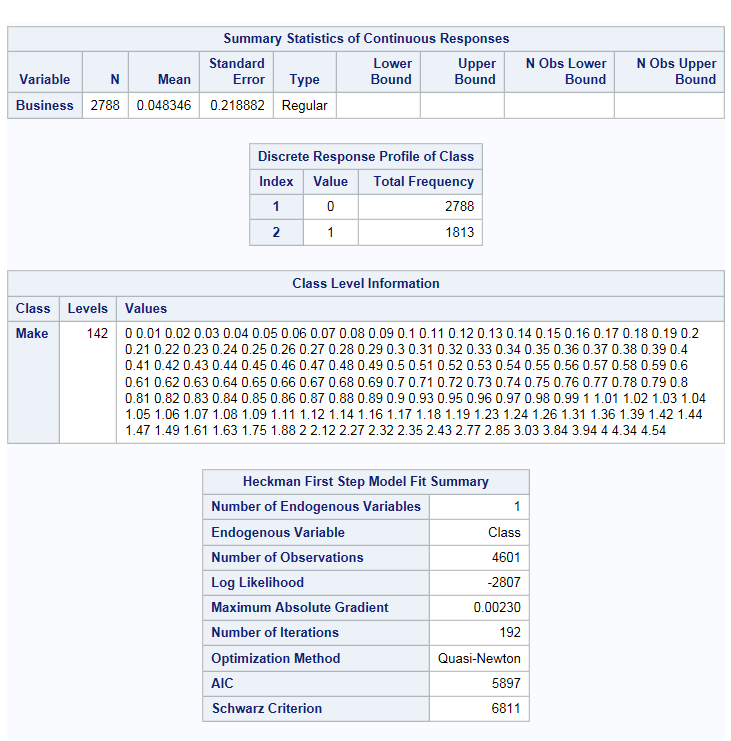
The Heckman two-step
selection method provides a means of correcting for non-randomly selected
samples. It is a two-stage estimation method. The first stage performs
a probit analysis on a selection equation. The second stage analyzes
an outcome equation based on the first-stage binary probit model.
Example: Heckman’s Two-Step Selection Method
To create this example:
-
TipIf the data set is not available from the drop-down list, click
 . In the Choose a Table window,
expand the library that contains the data set that you want to use.
Select the data set for the example and click OK.
The selected data set should now appear in the drop-down list.
. In the Choose a Table window,
expand the library that contains the data set that you want to use.
Select the data set for the example and click OK.
The selected data set should now appear in the drop-down list.

Assigning Data to Roles
To perform an analysis
that uses Heckman’s two-step selection method, you must assign
an input data set. To filter the input data source, click  .
Then under the Analysis heading, select Heckman’s
two-step selection method.
.
Then under the Analysis heading, select Heckman’s
two-step selection method.
.
Then under the Analysis heading, select Heckman’s
two-step selection method.
You must assign columns
to the Dependent variable roles for the selection
and outcome equations.
|
Role
|
Description
|
|---|---|
|
Outcome Equation
|
|
|
Dependent
variable
|
specifies a single numeric
column to use.
|
|
Continuous
variables
|
specifies the independent
variables (or regressors) to use in the model for the outcome equation
dependent variable.
|
|
Categorical
values
|
specifies the independent
variables to use to group the values into levels.
|
|
Include
the intercept
|
specifies whether to
include the intercept in the selection equation.
|
|
Selection Equation
|
|
|
Dependent
variable
|
specifies a single numeric
column that takes binary values. Select the value to use for the dependent
variable from the Select samples with dependent variable drop-down
list.
|
|
Continuous
variables
|
specifies the independent
variables (or regressors) to use in the model for the selection equation
dependent variable.
|
|
Categorical
variables
|
specifies the independent
variables to use to group the values into levels.
|
|
Include
the intercept
|
specifies whether to
include the intercept in the selection equation.
|
|
Additional Roles
|
|
|
Group analysis
by
|
enables you to obtain separate
analyses of observations for each unique group.
|
Setting Options
|
Option
|
Description
|
|---|---|
|
Methods
|
|
|
Optimization
method
|
specifies the iterative
minimization method to use.
You can use the default
method, or you can choose from these methods:
|
|
Maximum
number of iterations
|
specifies the maximum
number of iterations for the selected method. You can use the default
value or specify a custom value.
|
|
Variance
estimation method
|
specifies whether to
calculate the standard errors by using the corrected standard errors
or the OLS standard errors.
|
|
Type of
covariances of the parameter estimates
|
specifies the method
to calculate the covariance matrix of parameter estimates. You can
use the default value, or you can select the covariance from the inverse
Hessian matrix, from the outer product matrix, or from the outer product
and Hessian matrices (the quasi-maximum likelihood estimates).
|
|
Statistics
|
|
|
You can specify whether
the results include the statistics that the task creates by default,
the default statistics and any additional statistics that you select,
or no statistics.
Here is the information
that you can include in the results:
|
|
Copyright © SAS Institute Inc. All rights reserved.