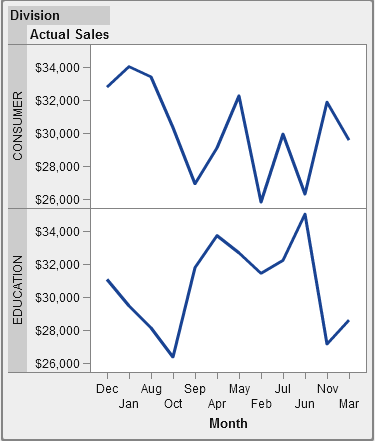
Example: Data-Driven Lattice
About the Data-Driven Lattice Example
Build the Graph Object for the Data-Driven Lattice Example
-
Save the graph object. See Saving a Custom Graph Object So It Appears in the Designer.
Copyright © SAS Institute Inc. All rights reserved.

