Working with Data Items in a Report
About Data Items
Each data source in
the designer includes one or more standard data items. You decide
which data items to use to define a query for each report object.
You can use all the data items in the data source or a subset of data
items. Each data item is classified as either a category or a measure.
For information
about filtering data items, see Working with Data Item Filters in a Report.


Select Data Items
To select data items
to use in queries for the current report section:
-
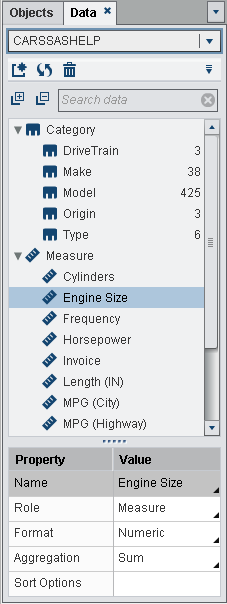
On the Data tab in the left pane, click the down arrow to display a list of available data sources. Select a data source and the Data tab is populated with a list of all of the data items that are in the data source.If the data source that you want is not in the list, click
 , which displays the Add Data Source window.
Select the data source that you want, and then click Add.
The Data tab is populated with a list of
all of the data items that are in the data source.
, which displays the Add Data Source window.
Select the data source that you want, and then click Add.
The Data tab is populated with a list of
all of the data items that are in the data source.
-
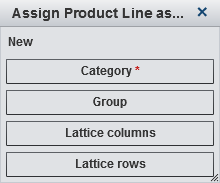
If the selected data item can replace a current data item in the report object or if the selected data item is valid for multiple data roles, then select the data assignment from the Assign <DataItemName> as window. A data assignment that is marked with a red asterisk (*) is required before the query can be run.
-
(Optional) To see more information about a data item, select it in the list. The Name, Role, Format, and Aggregation are displayed in the data item table below the list of data items. For a category data item with a user-defined format that has an underlying numeric value, you can specify Sort Options.
Search for Data Items


Sort Data Items on the Data Tab
To sort data items on
the Data tab, click  , and then select Sort Items
 Ascending By Name or Sort Items Descending By Name. The data items are sorted on the Data tab
within each grouping. The default sort is Ascending By
Name.
Ascending By Name or Sort Items Descending By Name. The data items are sorted on the Data tab
within each grouping. The default sort is Ascending By
Name.
, and then select Sort ItemsFor information about
sorting data values in report objects, see Sorting Data Items in Reports.
Duplicate Data Items
Duplicating measure
data items in the designer enables you to see the aggregations of
a data item (Sum, Average, Minimum, Maximum,
and Count) side by side in a table. You can
duplicate a numeric measure if you want to use it as a category to
group other values in some tables or graphs. If you save a report
with duplicate data items, then those data items are available when
you edit the report the next time.
You can duplicate a
calculated data item to make a variation of a calculation. For example,
you might make similar calculations involving miles per gallon for
a vehicle, but you create one calculation using MPG
(City) and another using MPG
(Highway). You can duplicate any data item if
you want to use it with more than one format in your report. For example,
you might change Month to Year for
a date data item.
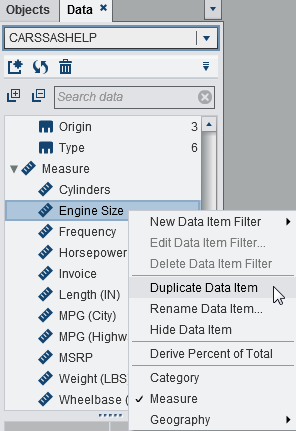
To duplicate a data
item:
-
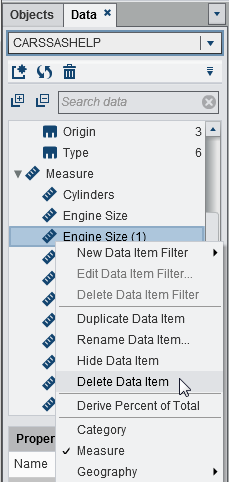
Select Duplicate Data Item. All of the properties of the original data item are copied to the duplicate data item. The duplicate data item appears in the list of data items on the Data tab. For example, if the original data item name is
Engine
                                 Size
, then the duplicate data item is displayed asEngine Size (1). If you choose to duplicate the same data item again, then it is displayed asEngine Size (2).
Derive a Distinct Count for a Category Data Item
A distinct count query
is useful in many ways. For example, you might want to know the number
of distinct products that were purchased during a specific time period.
Or, you might want to know which products have the most customers
or which products have the most customers in a particular geographic
region. You can derive a distinct count for category data items only.
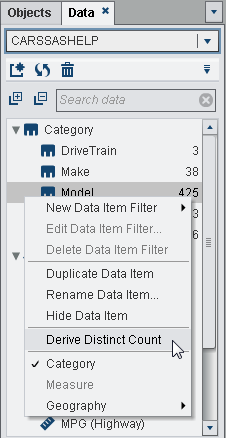
To derive a distinct
count data item:
-
The distinct count data item appears in the list of data items with a name that is derived from the original name. For example, if the original data item name is
Date, then the distinct count category data item is displayed asDate (Distinct Count). The icon identifies the new distinct count category data
item on the Data tab.
icon identifies the new distinct count category data
item on the Data tab.
Derive a Percentage of Total for a Measure
You can derive the percentage
of total for a measure as a new aggregated measure in the designer.
The aggregated measure does not contain data values in itself, but
when it is used in a report object, it displays the percentage of
the total value for the measure on which it is based.
Note: The percentage of total is
relative to the subset of data that is selected by your filters and
ranks.
For example, you might
derive the percentage of total for a measure that contains revenue
values. If you create a bar chart of the aggregated measure and a
category that contains product lines, then the bar chart shows the
percentage of total revenue for each product line.
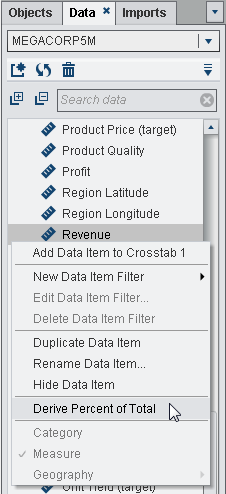
To derive a percentage
of total from a measure data item:
-
The percentage of total measure data item appears in the list of aggregated data items with a name that is derived from the original name. For example, if the original measure data item name is
Revenue, then the percentage of total measure data item is displayed asRevenue (Percent of Total). The icon identifies the new percentage of total measure
data item on the Data tab.
Create Geography Data Items
A geography data item
can be useful if your data contains values that are mapped to geographical
locations or regions. For example, a geography data item can identify
geographic information that is specific to your organization (for
example, sales regions, warehouse locations, oil platforms, and so
on).
If you change a numeric
measure to a geography data item, then it automatically becomes a
category data item.
Starting with the 6.2
release, you do not have to use a custom geography data item. You
can use the geography items that are available in SAS Visual Analytics.
These geography data items are Countries, US
States, US States Abbreviated, US
ZIP Codes, and Custom. To access
these geography data items, select the Data tab
in the left pane. Right-click the data item that you want to use for
the geography data item, and then select Geography.
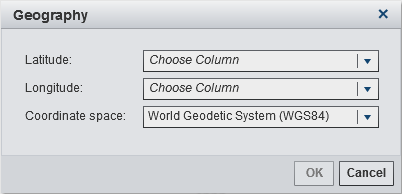
To create a custom
geography data item:
Modify Data Item Properties
Modify a Data Item’s Role
You can modify a data
item’s role. For example, you might want to modify a measure
data item to be a category data item. A data item's role cannot
be changed if that data item is in use in the report. However, duplicating
the data item allows the new data item to have a different role.
Note: You cannot change the role
for the frequency data item or the frequency percent data item. You
cannot change the role for an aggregate measure.
To modify a data item’s
role:

Modify the Format of a Numeric Measure Data Item or a Date, Datetime, or Time Data Item
You can modify the format
of a numeric measure data item or a date, datetime, or time data item.
You can also modify the format of a data item with a user-defined
format, as long as the user-defined format is based on an underlying
numeric value.
Note: You cannot modify the format
of a data item that is being used in a filter or as part of a calculated
or aggregated measure.
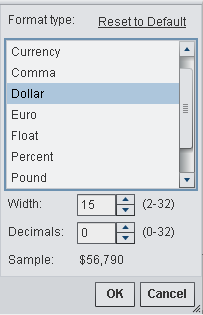
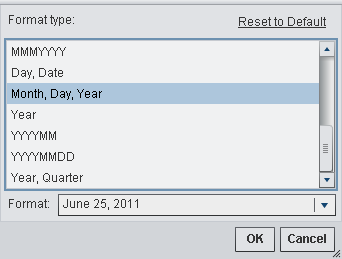
To change the format:
-
In the data item table, select the existing format. A list is displayed with the Format type, Width, and Decimals (for numeric data items). Make your selections. A sample of your selection is displayed under the list.Note: There are different format variations available for some format types for date, datetime, and time data items. Select the format variation based on the sample value displayed in the Format drop-down list.
Modify User-Defined Formats
In the designer, user-defined
formats that are defined in the SAS LASR Analytic Server are applied
to the results, even though the Format property
of the data item does not display the name of the applied user-defined
format. You can change the format for an underlying numeric data item,
but you cannot change the format for an underlying character-based
data item. If you change the numeric format, you can restore the user-defined
format by selecting Reset to Default.
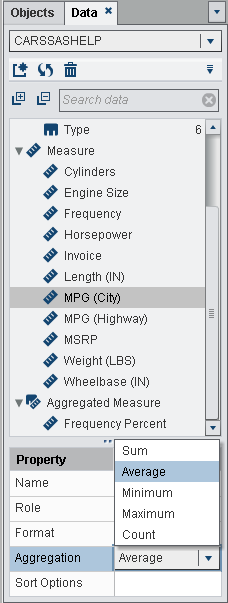
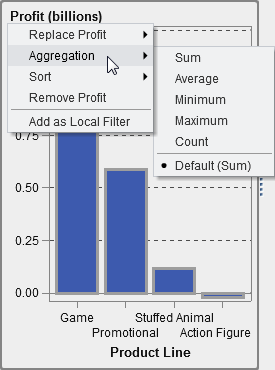
Modify How a Measure Is Aggregated
You can change the aggregation
method for a measure in a data source using the Data tab
or a report object in the canvas.
Note: You need to understand your
data because some aggregation methods are not always appropriate.
For example, an average of an average is not valid.
To change the aggregation
method using the Data tab:
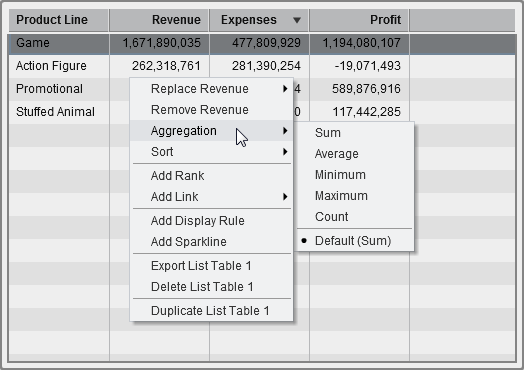
To change the aggregation
method when you are working with a report object in the canvas:
Modify the Sort Options for a Category Data Item
Using the data item
table on the Data tab, you can change the Sort
Options for a category data item with a user-defined
format that is based on an underlying numeric value. The sort options
are the following:
Delete Data Items
You can delete data
items that you have created in the designer (for example, calculated
data items or duplicated data items) so that they no longer appear
on the Data tab in the left pane.
You cannot delete a
data item that is inside a hierarchy if it reduces the hierarchy to
a single level. You cannot delete a data item if it is the last or
only reference to a column in the original data source. You cannot
delete a data item if it is used in a calculated data item, aggregate
measure, or a geography data item.
Tip
You can hide a data item that
you cannot delete by right-clicking on the data item name in the Data tab,
and then selecting Hide Data Item. For more information,
see Showing or Hiding Data Items.To delete a data item
(or data items):
Copyright © SAS Institute Inc. All rights reserved.