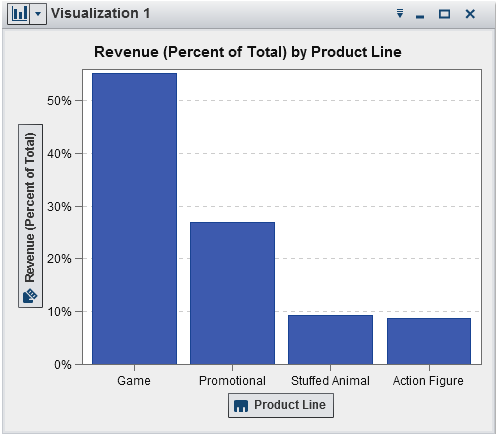
Using Percentages of Total
About Percentages of Total
You can derive the percentage
of the total for a measure as a new aggregated measure. The aggregated
measure does not contain data values in itself, but when it is used
in a visualization, it displays the percentage of the total value
for the measure on which it is based.
Note: The percentage of total is
relative to the subset of data that is selected by your filters and
ranks.
Derive the Percentage of Total for a Measure
To derive the percentage
of the total for a measure, right-click on a measure in the Data pane,
and then select Derive Percent of Total.
The derived measure appears automatically in the Data pane.
The name of the aggregated measure is the same as the measure on which
it is based, with the suffix “(Percent of Total).”
Copyright © SAS Institute Inc. All rights reserved.