Using Tables to Display Results
Overview of the Table Types
About List Tables
A list
table is a two-dimensional representation of data in
which the data values are arranged in unlabeled rows and labeled columns.
List tables can use any data items from a data source. A list table
cannot use a hierarchy or a percentage of total item.
By default, a list table
contains aggregated data with one row for each distinct combination
of category values. However, if the Show detail data check
box has been selected, then all of the data is not aggregated.
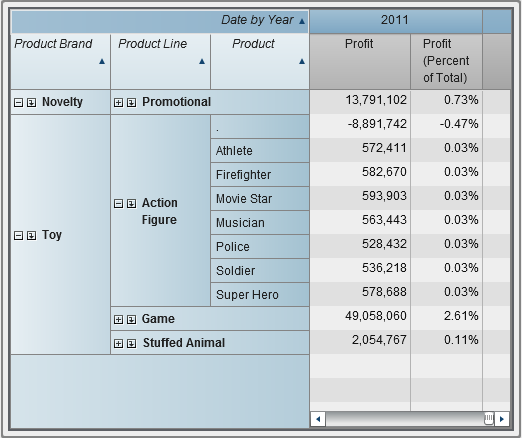
About Crosstabs
A crosstab (also
known as a crosstabulation table) shows an aggregate metric for the
intersections of two or more categories. Crosstabs often have two
or more categories assigned to both the rows and columns, forming
a matrix. Crosstabs can be easier to read than list tables because
they often use less space, and they always collapse repeating values
for outer category data items into one unique value, which is known
as grouping. You can choose to show subtotals and totals by selecting
the appropriate check box (or check boxes) on the Properties tab
for the crosstab. A crosstab can use a hierarchy.


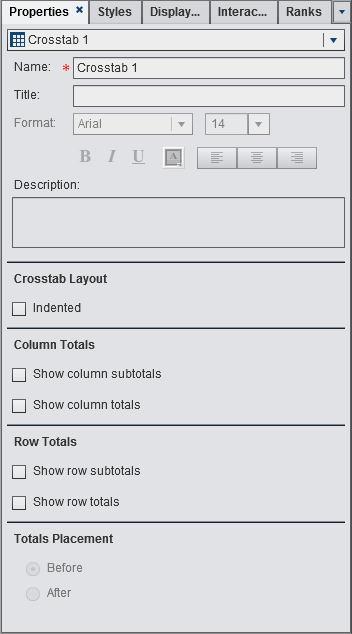
Specify Table Properties
To specify the properties
for tables:
-
For a list table, you can specify that you want to enable sorting and that you want to show detail data, headings, and totals.For a crosstab, you can specify that you want an indented layout and totals and subtotals for columns, rows, or both. You can specify the placement of the totals and subtotals. For more information, see Add Percentage of Total or Percentage of Subtotals to a Crosstab.
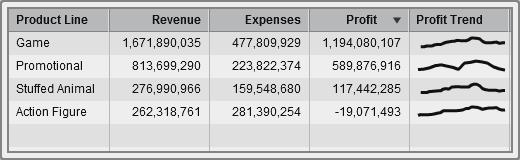
Add Sparklines to a List Table
A sparkline is
a small line graph that presents a single trend over time. A sparkline
is about the size of one or two words, so it fits in a single cell
and repeats for each row in a column. A sparkline does not have axes
or labels. They are frequently used to present stock trends or production
rates over time. A sparkline is intended to be both succinct and noteworthy.
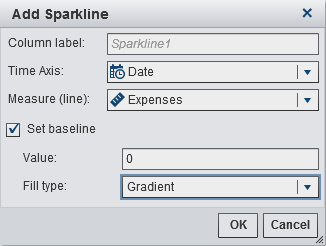
In the designer, you
can add sparklines to a column in a list table. The data source for
the list table must include a date, datetime, or time data item before
you can add a sparkline.
To add sparklines:
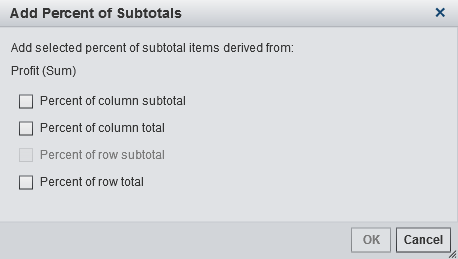
Add Percentage of Total or Percentage of Subtotals to a Crosstab
You can add a percentage
of total, a percentage of column total, a percentage of column subtotal,
a percentage of row total, and a percentage of row subtotal to a crosstab
in the designer. You can create these percentages only when the source
data item has an aggregation of Sum or Count.
Note: The percentage of total or
percentage of subtotals is relative to the subset of data that is
selected by your filters and ranks.
To add a percentage
of total to a crosstab:
To add a percentage
of subtotals to a crosstab:
Copyright © SAS Institute Inc. All rights reserved.