Creating Interactions
Creating a Filter Interaction
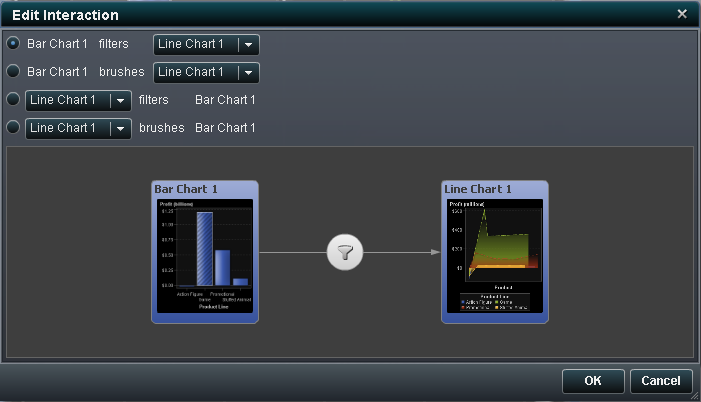
To create a filter
interaction using the interaction view:
-
Click
 to switch to the layout view. Select data in the
source report object to filter data in the target report object (or
objects).
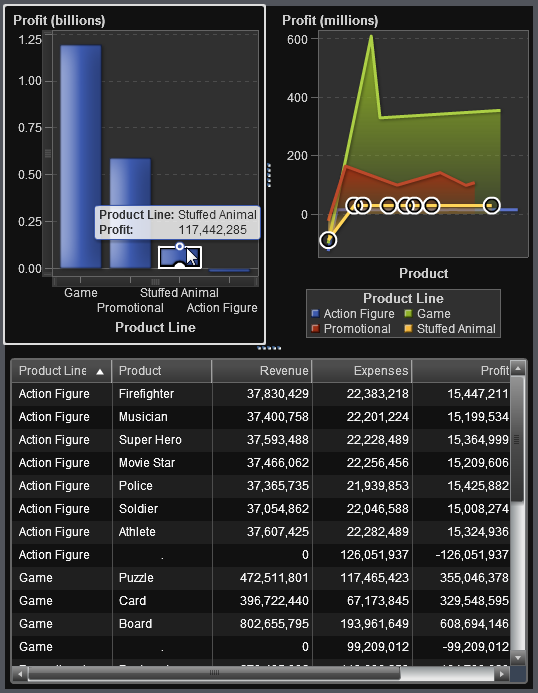
In the following example, the promotional product line was selected in the bar chart. Simultaneously, the line chart and the list table show the same filter.A Filtering Example with a Bar Chart, a Line Chart, and a List Table
to switch to the layout view. Select data in the
source report object to filter data in the target report object (or
objects).
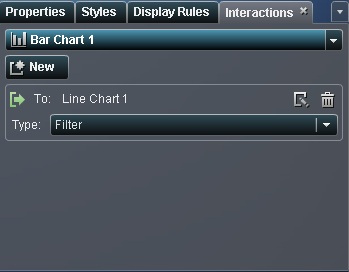
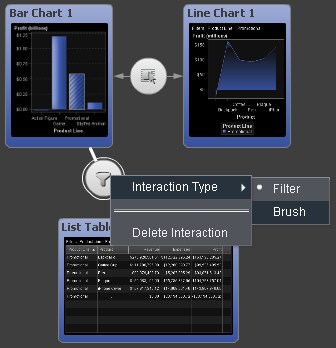
In the following example, the promotional product line was selected in the bar chart. Simultaneously, the line chart and the list table show the same filter.A Filtering Example with a Bar Chart, a Line Chart, and a List Table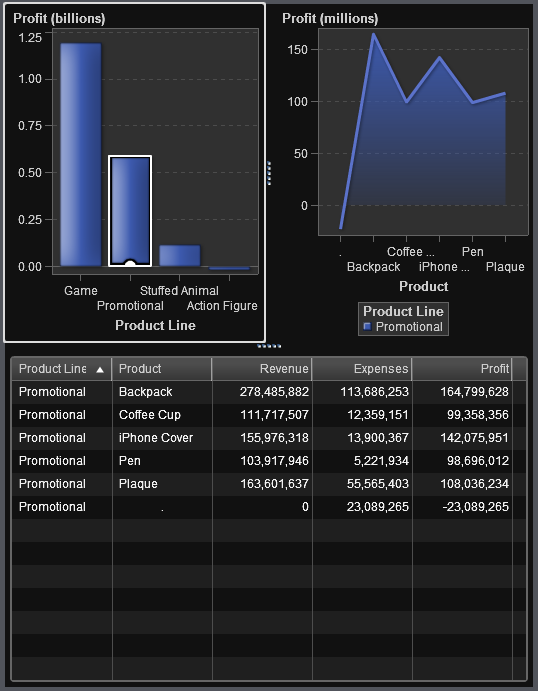 Clicking another selection applies the filter based on your new selection. For example, in the report above, you can click the game product line to change the filter.The following example shows the Interactions tab for the filtering example shown in A Filtering Example with a Bar Chart, a Line Chart, and a List Table .Interactions Tab with Two Interactions Displayed
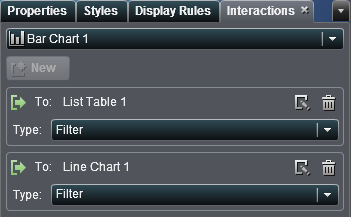


To create an interaction
using the Interactions tab:


Copyright © SAS Institute Inc. All rights reserved.