Specifying Your Preferences for SAS Visual Analytics Administrator

The Manage Environment panel in SAS Visual Analytics Administrator enables you to specify the following preferences:
  • Select a SAS Application Server.
  • Specify the sample rate for Resource Monitor and Process Monitor.
  • Record actions as SAS statements in a single file or in separate files.
Here is a display of the Manage Environment panel within the Preferences window.
Manage Environment Panel in the Preferences Window
Manage Environment Panel
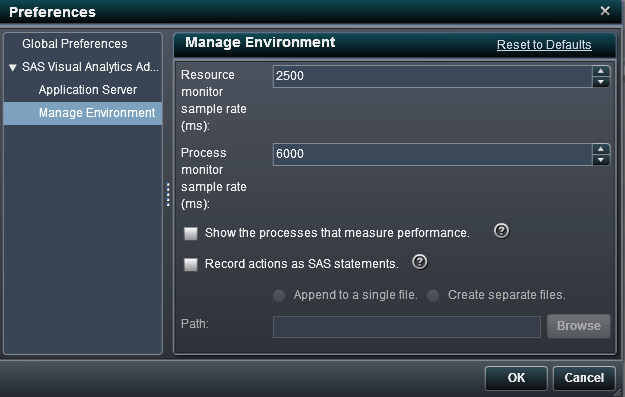
You can record SAS statements to a single file or within separate files. This feature enables administrators to review the SAS statements for a task. Some of these tasks are starting and stopping a server connection, and loading and unloading tables. The statements in the file can be modified and scheduled. For more information about the LASR and HPDS2 procedures, see the SAS LASR Analytic Server: Administration Guide.
Note: The recorded statements do not include information about the metadata server connection. The connection information is often supplied in options such as METASERVER=, METAPORT=, METAUSER=, or METAPASS=. These options are needed to run the PROC METALIB statement that is included in jobs that register tables. The affected jobs are the prepare data and add to data server jobs. For information about the metadata server connection options, see SAS Language Interfaces to Metadata.
To specify preferences that are specific to SAS Visual Analytics Administrator:
  1. Select Filethen selectPreferences to open the Preferences window.
  2. Select SAS Visual Analyticsthen selectApplication Server.
    Select a SAS Application Server to use from the menu. If you have added SAS Application Server instances to your deployment, make sure that Job Execution Services has been configured to use the application server. For more information, see SAS Intelligence Platform: Middle-Tier Administration Guide.
  3. Select SAS Visual Analyticsthen selectManage Environment. Enter values for the following preferences:
    Parameter
    Sample Value or Task
    Description
    Resource monitor sample rate (ms)
    1000
    Specify the sampling rate that the resource monitor uses for polling the machines in the cluster.
    Process monitor sample rate (ms)
    6000
    Specify the sampling rate that the performance monitor uses for polling application instances.
    Show the processes that measure performance
    Selected
    By default, the processes that measure performance are filtered from the graphs in the Process monitor. However, if several instances of the processes that measure performance are running, they can reduce performance. By selecting the check box, you can view and monitor the processes that measure performance.
    Record actions as SAS statements
    Selected
    Click one of the two options that are available, and specify a folder path or a fully qualified filename. You can either append the SAS statements to a single file or create separate files that record actions as SAS statements. Files are saved either as .txt files or as .sas files. Actions such as starting or stopping server connections, and loading or unloading tables are recorded.
  4. Click OK to apply your changes.

See Also

SAS Visual Analytics: Administration Guide