Using Gauges to Display Results

Overview of the Gauge Types

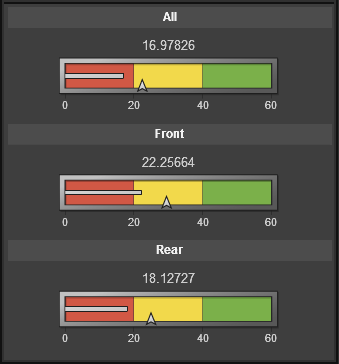
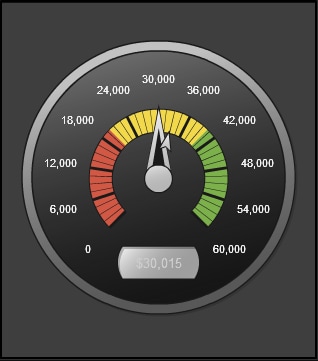
A gauge displays the status or measure of a variable or variables in relation to a target, goal, or interval. Gauges are designed to achieve this goal in a way that is familiar to users. Many real-life objects use gauges, such as cars and machines. Gauges can be used to display a quantity, range, variable, or status.
The following gauges are available in SAS Visual Analytics Designer:
A Bullet Gauge
A Bullet Gauge
A Slider Gauge
A Slider Gauge
A Thermometer Gauge
A Thermometer Gauge
A Dial Gauge
A Dial Gauge
A Speedometer Gauge
A Speedometer Gauge

Inserting a Gauge into a Report

To insert a gauge into a report:
  • Drag the gauge icon from the Objects tab in the left pane and drop it onto the report canvas.
  • Select Insertthen selectGauges and then select the menu item for the gauge object that you want to insert. The gauge is automatically placed in the report canvas. If you want the gauge to appear in a different place, then drag and drop it in a new location.
The following table lists the available gauge objects:
Icon
Gauge Type
bullet icon
Bullet
slider icon
Slider
thermometer icon
Thermometer
dial icon
Dial
speedometer icon
Speedometer

Specify Gauge Properties

To specify properties for gauges:
  1. If not already selected, select the gauge in the report canvas that you want to update.
  2. In the right pane, click the Properties tab.
  3. Update the general properties for the gauge. The available properties depend on the selected gauge type. For example, for a dial gauge, you can specify General and KPI Chart properties.
    Here is an example of the properties for a dial gauge:
    Properties for a Dial Gauge
    Properties for a Dial Gauge

Specify Gauge Styles

To specify styles for gauges:
  1. If not already selected, select the gauge in the report canvas that you want to update.
  2. In the right pane, click the Styles tab.
  3. Update the styles for the gauge. The available styles depend on the selected gauge type. For example, for a pie chart, you can specify Data Styling, Frame Styling, and Text Styling.
    Here is an example of the styles for a dial gauge:
    Styles for a Dial Gauge
    Styles for a Dial Gauge