Using Controls to Display Results

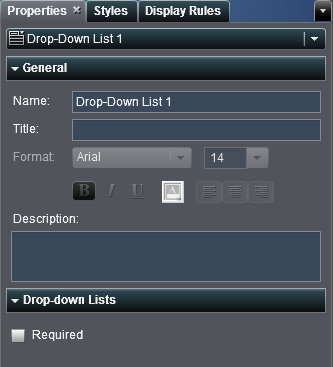
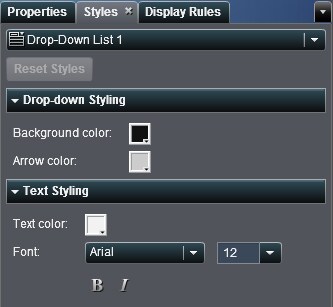
Overview of the Control Types

A control is a report object that filters or narrows the scope of the data that you are currently viewing. A control enables you to group your data by a selected category and then select which group you want to view. Controls can be used in a report with interactions.
Only the drop-down list, button bar, and text input controls can be used in section prompts. If the same data source is used, then a control that is used in a section prompt automatically filters all other report objects in the same section.
The following controls are available in SAS Visual Analytics Designer:
A Drop-down List Control
A List Control
A List Control
A Button Bar Control
A Button Control
A Text Input Control
A Range Slider Control

Insert Controls into a Report

To insert a control into a report:
  1. Choose one of the following:
    • Drag the control icon from the Objects tab in the left pane and drop it onto the report canvas.
    • Select Insertthen select Controls and then select the menu item for the control object that you want to insert. The control is automatically placed in the report canvas. If you want the control to appear in a different place, then drag and drop it in a new location.
    The following table lists the available controls:
    Icon
    Control Type
    drop–down list icon
    Drop-down List
    list icon
    List
    button bar icon
    Button Bar
    text input icon
    Text Input
    range slider icon
    Range Slider
  2. Specify the data item that you want to use in the filter control:
    • Drag and drop a category data item onto the control.
    • Use the Roles tab in the right pane and then specify the category as the Filter.

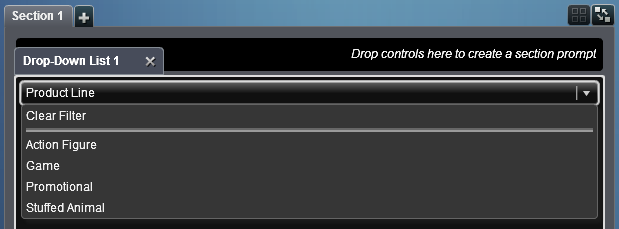
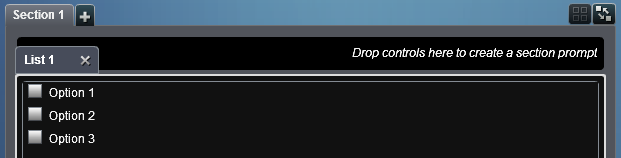
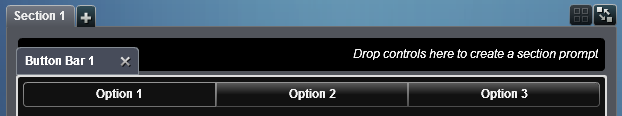
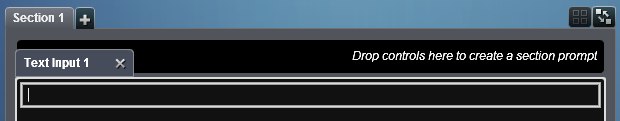
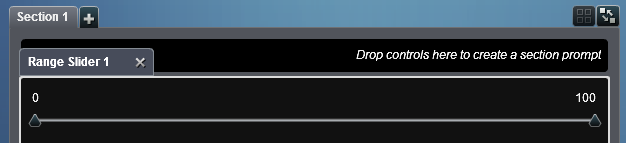
Use a Control to Create a Section Prompt

The drop-down list, button bar, and text input controls are the only ones that can be used as section prompts.
To use control to create a section prompt:
  1. Drag the control icon from the Objects tab in the left pane and drop it onto the area above the report canvas. (Look for the hint text that says, “Drop controls here to create a section prompt.”) The control appears above the report canvas.
  2. Drop a category onto the control. For example, if you drag and drop a drop-down list control, then you can assign a category like Facility City or Facility Sate. Then the drop-down list is populated with the cities or states that are used in that category.
    You can also use the Roles tab in the right pane, and then specify the category as the Filter.
If you use a control to create a section prompt, then the user can select a value (or values, if multi-selection is available) to filter the data. Note that for some control types, the user might need to press Ctrl + click to clear the value in the filter.

Specify Control Properties

To specify the properties for a control:
  1. If not already selected, select the control in the report canvas that you want to update.
  2. In the right pane, click the Properties tab.
  3. Update the general properties for the control. Your choices are Name, Title, and Description.
  4. Update the specific properties for the control. The available properties depend on the selected control.
    Here is an example of the properties for a drop-down list control:
    Properties for a Drop-down List Control
    Properties for a Drop-down List Control

Specify Control Styles

To specify styles for controls:
  1. If not already selected, select the control in the report canvas that you want to update.
  2. In the right pane, click the Styles tab.
  3. Update the styles for the control. The available styles depend on the selected control type. For example, for a drop-down list, you can specify Drop–down Styling and Text Styling.
    Here is an example of the styles for a drop-down list control:
    Styles for a Drop-down List Control
    Styles for a Drop-down List Control