You can add display
rules to graphs. Note that you cannot create a display rule to highlight
dates in a graph.
Note: Display rules can be added
to a waterfall chart only if the
Color by response sign check
box is selected on the
Properties tab in
the right pane.
To specify a new display
rule for a graph:
-
If not already selected,
select the graph in the report canvas that you want to update.
-
In the right pane, click
the
Display Rules tab. Click

. The
Add Display Rule window
is displayed.
-
Select a
Column
or value for the display rule.
-
Click in the box to
enter a value for the display rule in the field.
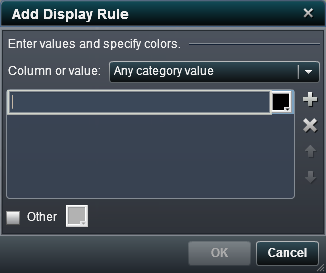
Add Display Rule Window for a Graph
-
Select a color for the
display rule.
-
(Optional) Repeat the
steps for entering a value and selecting a color. Use the arrows to
move values up or down.
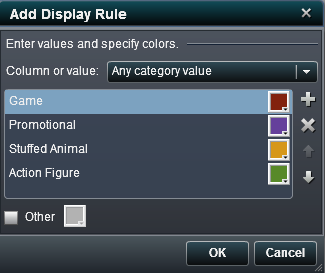
In the following example,
values and colors have been specified for each product line in a bar
chart.
Add Display Rule Window with Values and Colors Specified
-
(Optional) Select the
Other check
box. Then select a color.
-
Click
OK.
The graph updates with the new display rule.
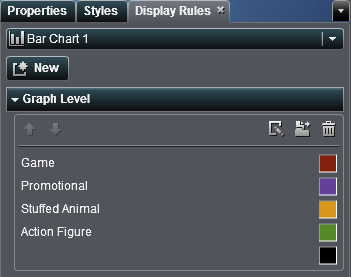
The display rule appears
on the
Display Rules tab in the right pane.
Display Rules Tab with the Display Rules for a Graph
-
(Optional) Click

on the
Display Rules tab
to edit the new display rule.
-
(Optional) Click

in the
Display Rules tab
to move the new graph-level display rule to a report-level display
rule.