Adding Table-Level Display Rules
You can add three different types of display rules
to tables. Note that you cannot create a display rule to highlight
dates in a table.
Adding Display Rules Using a Gauge
To specify a new display
rule for a table using a gauge:
-
If not already selected,
select the table in the report canvas that you want to update.
-
In the right pane, click
the
Display Rules tab. Click

. The
Add Display Rule window
is displayed.
-
Select
Gauge as
the
Type. The
Add Display Rule window
for gauges is displayed.
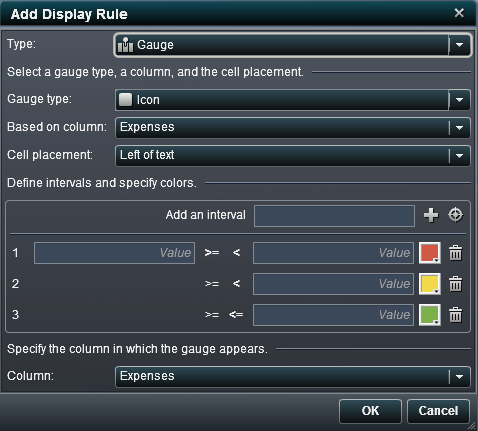
Add Display Rule Window for a Gauge
-
Select a
Gauge
Type from the drop-down list. Your choices are a bullet,
an icon, a slider, or a thermometer.
Icon is
the default.
-
Using the
Based
on column drop-down list, specify which column the rule
should be based on in the report.
-
Specify where the gauge
should appear in the column for the
Cell Placement.
Your choices are
Left of text,
Right
of text, or
Replace text.
-
Define the intervals
and colors for the rule:
-
Enter the individual values for
the intervals and then select a color. You can click the operator
between the intervals to change it.
-
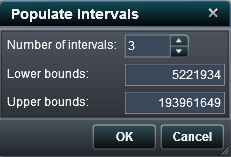
Click

to automatically populate the intervals. The
Populate
Intervals window is displayed.
Populate Intervals Window
You can specify the
Number
of intervals, the
Lower bounds,
and the
Upper bounds. Click
OK.
-
Specify the
Column in
which you want the gauge to be displayed
-
Click
OK.
The display rule updates with the new display rule. The display rule
appears on the
Display Rules tab in the right
pane.
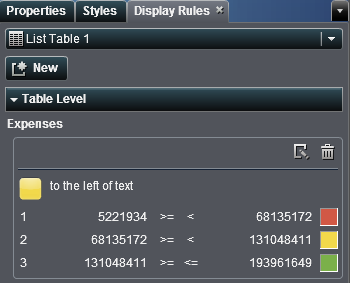
Here is an example
of an automatically populated display rule that uses an icon:
Display Rules Tab with the Display Rules for an Icon
-
(Optional) Click

on the
Display Rules tab
to edit the new display rule.
Adding Display Rules Using an Expression
To specify a new display
rule for a table using an expression:
-
If not already selected,
select the table in the report canvas that you want to update.
-
In the right pane, click
the
Display Rules tab. Click
. The
Add Display Rule window
is displayed. The
Expression type is displayed
by default.
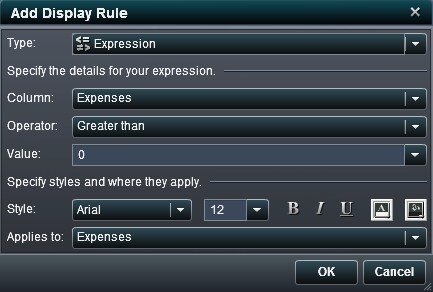
Add Display Rule Window for an Expression
-
Select the
Column or
any measure value.
-
Select the
Operator.
Your choices are
Greater than,
Is,
Is
not,
Between,
Less
than,
Less than or equal to,
Greater
than,
Greater than or equal to,
Is
missing, or
Is not missing.
The default is
Greater than.
-
-
Modify the style, size,
and color of the font.
-
Select the row or column
in the
Applies to drop-down list.
-
Click
OK.
The table updates with the new display rule. The display rule appears
on the
Display Rules tab in the right pane.
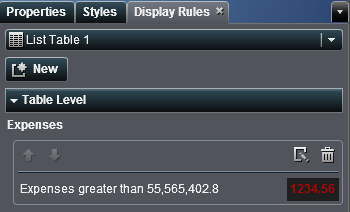
Here is an example
of a display rule that uses an expression:
Display Rules Tab with the Display Rules for an Expression
-
(Optional) Click
on the
Display Rules tab
to edit the new display rule.
Adding Display Rules Using Color-Mapped Values
To specify a new display
rule for a table using color-mapped values:
-
If not already selected,
select the table in the report canvas that you want to update.
-
In the right pane, click
the
Display Rules tab. Click
. The
Add Display Rule window
is displayed.
-
Select
Color-mapped
values as the
Type. The
Add
Display Rule window for color-mapped values is displayed.
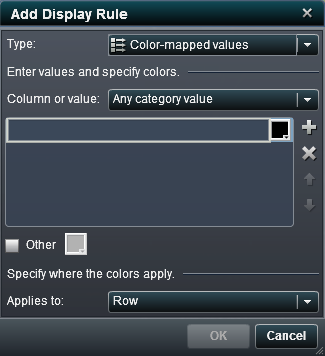
Add Display Rule Window for Color-Mapped Values
-
Select the
Column
or value to which you want to apply the display rule.
-
Click in the box to
enter a value for the display rule.
-
Select a color for the
display rule.
-
(Optional) Repeat the
steps for entering a value and selecting a color.
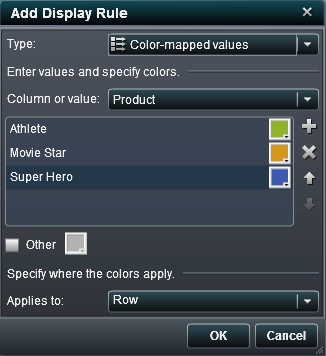
In the following example,
values and colors have been specified for products in a list table.
Add Display Rule Window with Color-Mapped Values Displayed
-
(Optional) Select the
Other check
box. Then select a color.
-
Using the
Applies
to drop-down list, specify where you want to apply the
colors.
-
Click
OK.
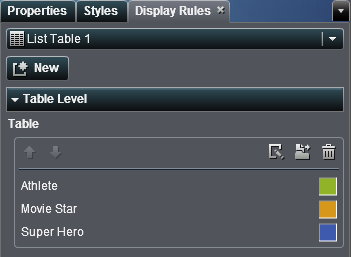
The table updates with the display rules.
The display rule appears
on the
Display Rules tab in the right pane.
Add Display Rule Window with Color-Mapped Values Displayed
Copyright © SAS Institute Inc. All rights reserved.