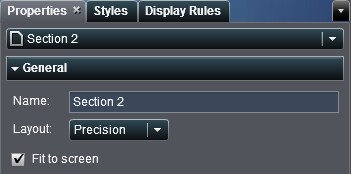
Choosing a Report Layout
Precision
enables you to place,
align, and size report objects. The precision layout allows objects
to overlap and lets users control the depth order of these overlapping
objects by sending objects backward or bringing them forward. (For
example, you might want your company logo to display behind a bar
chart and a pie chart in your report).
Tiled
provides you a quick
way to place report objects directly next to other report objects.
The report objects cannot overlap. All report objects in the section
are sized to fit one screen. If you adjust the size of an object,
then the other objects automatically resize to ensure that all objects
continue to fill the entire screen.
Note: You can switch from the tiled
layout to the precision layout after you have added report objects
to your report. However, this action can change the size and the position
of the report objects.
To choose your report
layout:
Copyright © SAS Institute Inc. All rights reserved.