Using Tables to Display Results
Overview of the Table Types
About Crosstabs
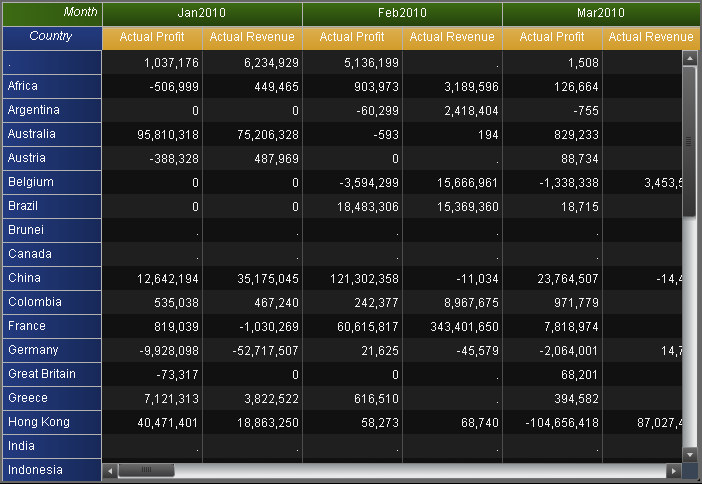
A crosstab (also
known as a crosstabulation table) shows an aggregate metric for the
intersections of two or more categories. In a crosstab, categories
are typically displayed on both the columns and the rows, and each
cell value represents the aggregated measure from the intersection
of the categories on the specific row and column. This type of table
uses less space than a list table and is easier to read because data
is grouped both horizontally and vertically.


