This example shows you
how to filter out terms using the
Text Filter node.
This example assumes that you have performed
Using the Text Parsing Node, and builds
off the process flow diagram created there.
-
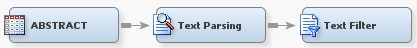
Select the
Text
Mining tab on the toolbar, and drag a
Text
Filter node into the diagram workspace.
-
Connect the
Text
Parsing node to the
Text Filter node.
-
In the diagram workspace,
right-click the
Text Filter node and select
Run.
Click
Yes in the
Confirmation dialog
box.
-
Click
Results in
the
Run Status dialog box when the node finishes
running.
-
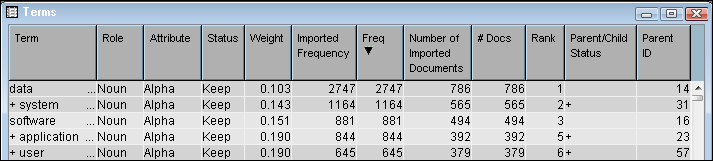
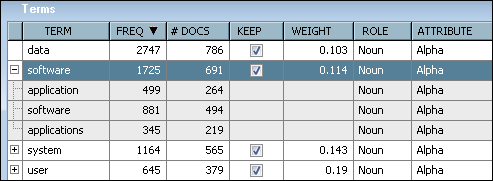
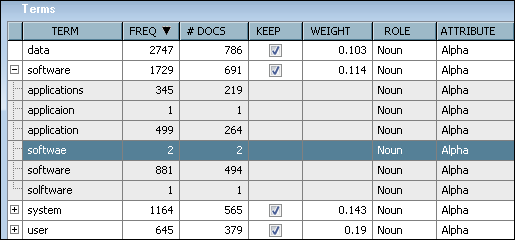
Select the
Terms table.
Sort the terms by frequency by clicking the Freq column heading.
Assume that for this
text mining analysis, you know that “software” and “application”
are really used as synonyms in the documents that you want to analyze,
and that you want to treat them as the same term.
-
Close the
Results window.
Select the
Text Filter node, and then click
the

for the
Filter Viewer property.
-
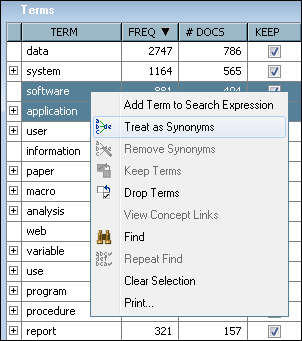
In the
Interactive
Filter Viewer sort the terms in the Terms table by frequency.
Hold Ctrl down on your keyboard, select “software” and
“application”, and then right-click “software”
and select
Treat as Synonyms from the drop-down
menu.
-
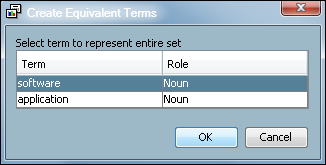
In the
Create
Equivalent Terms dialog box, select
software as
the term to represent both terms in the Terms table.
-
Click
OK in
the
Create Equivalent Terms dialog box. Notice
that the term “software” now represents both terms in
the
Terms table. Expand the term “software”.
-
Close the
Interactive
Filter Viewer. When prompted whether you would like to
save your changes, select
Yes.
-
Right-click the
Text
Filter node, and select
Run.
Select
Yes in the
Confirmation dialog
box. Select
Results in the
Run
Status dialog box when the node has finished running.
-
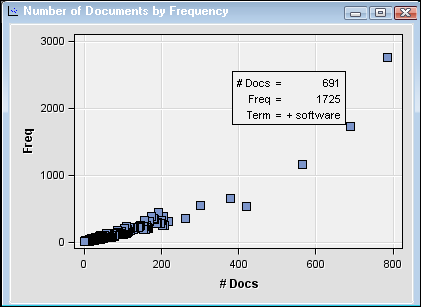
Select the
Number
of Documents by Frequency plot to see how both terms
are now treated as the same.
You can also use options
to change your view or specify a subset of results to appear in a
plot. For example, consider that you want to refine this plot to only
show terms that appear in more than 200 documents.
-
Right-click the
Number
of Documents by Frequency plot, and select
Data
Options.
-
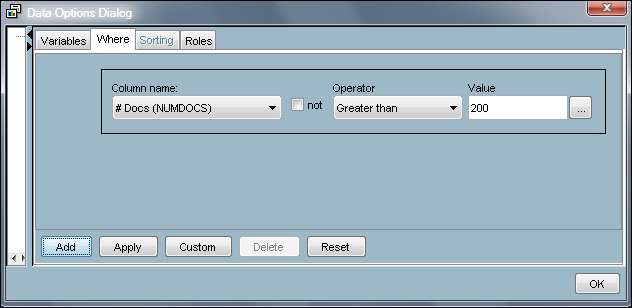
Select the
Where tab
in the
Data Options Dialog box. Select
#
                              Docs
from the
Column name drop-down
menu. Select
Greater than from the
Operator drop-down
menu. Type
200 in the
Value text
box.
-
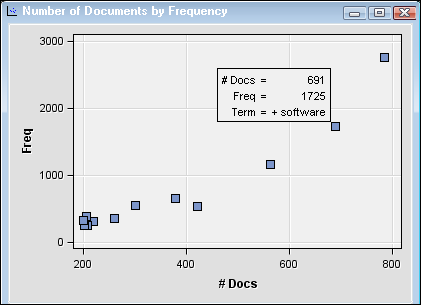
Click
Apply,
and then click
OK. The
Number
of Documents by Frequency plot resizes and includes only
terms that occur in more than 200 documents.
-
Close the
Results window.
In addition to resizing or subsetting a plot to help focus your analysis,
you can also directly search for terms using the
Interactive
Filter Viewer.
-
Select the
Text
Filter node, and then click the
for the
Filter Viewer property.
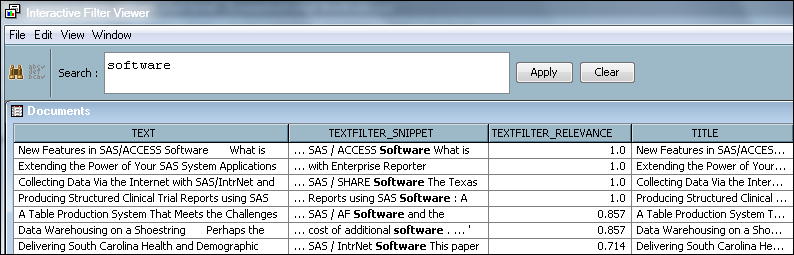
In the
Interactive Filter Viewer, type
software in
the
Search text box, and click
Apply.
The Documents table
provides a snippet of text that includes the term that you are searching
for. You can use information in the Documents table to help you understand
the context in which a term is being used. To do so, examine the snippet
result in addition to the full text and title of the document. For
more information about the
Interactive Filter Viewer,
see the Interactive Filter Viewer topic in the SAS Text Miner Help.
Searching for a term
in the
Interactive Filter Viewer raises an
interesting problem. As shown above, a search for “software”
is case insensitive. However, what if there are instances of a term
that you want to find that are misspelled in the document collection?
You can also check for spelling when filtering terms using a dictionary
data set.
-
Close the
Interactive
Filter Viewer, and select
No when
prompted for whether you want to save changes.
-
(Optional) Select the
Text
Filter node, and set the
Check Spelling property
to
Yes. When you rerun the
Text
Filter node, terms will be checked for misspellings.
You can also specify a data set to use in spell-checking by clicking
the
for the
Dictionary property
and selecting a data set. For information about creating a dictionary
data set, see the How to Create a Dictionary Data Set topic in the
SAS Text Miner help.
Right-click the
Text
Filter node, and select
Run.
Select
Yes in the
Confirmation dialog
box. When the node finishes running, select
OK in
the
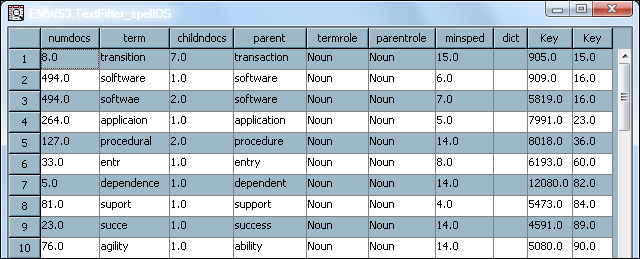
Run Status dialog box. Click the
for the
Spell-Checking Results property
to access a window in which you can view the data set that contains
spelling corrections that were generated during spell-checking. For
example, the term "softwae" is identified as a misspelling of the
term "software."
You can see this relationship
in the Terms table in the Interactive Filter Viewer. Click the
for the
Filter Viewer property.
Expand the term "software" in the Terms table to view its synonyms.
The synonyms include "softwae," which was identified as a misspelled
term during spell-checking.
Notice that the synonyms
also include "application," which was created in steps 7-10 of this
example, and "applicaion," which was identified during spell-checking
as a misspelling of "application."