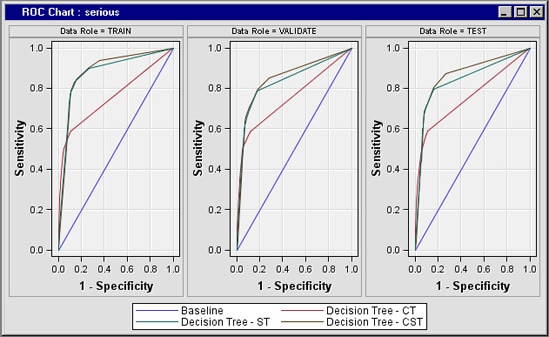
Compare the Models

To compare the models:
  1. From the Assess tab, drag and drop a Model Comparison node in the diagram workspace. Connect all three Decision Tree nodes to it. The Model Comparison node enables you to compare the performance of the three different models. Your diagram should look something like the following:
    Process flow diagram
  2. Right-click the Model Comparison node, and select Run. Click Yes in the Confirmation dialog box. Click Results in the Run Status dialog box when the Model Comparison node has finished running.
  3. Maximize the ROC Chart.
    The greater the area under the curve, the better the model. The red line in the following image shows the results of the model using COSTART terms, the green line shows the results of the SYMPTOM_TEXT terms, and the brown line shows the results of the combined COSTART and SYMPTOM_TEXT terms. The worst model uses only the COSTART terms, while the best model uses a combination of COSTART and SYMPTOM_TEXT. Apparently, text mining can add information not contained in the COSTART terms. The text mining model provides better results than the keyword-based model. Combining the models offers the best results.
    ROC Chart window
  4. Select View Arrow Assessment Arrow Classification Chart from the menu at the top of the Results window to view the Classification Chart.
    Note: Blue indicates correct classification and red indicates incorrect classification.
  5. Close the Results window. It would be useful to see which variables are most important in the combined model for predicting serious events.
  6. Right-click on the Decision Tree — CST node and select Results to view the results of the combined Decision Tree models.
  7. Click the Output window to maximize it. Scroll through the output to the Variable Importance results.
    Note: The SVD terms are more important than the individual terms in predicting a serious adverse event.
  8. Minimize the Output window, and then maximize the window that contains the decision tree. Browse the decision tree results.