Examine Data Segments
In this section,
you will examine segmented or clustered data using the Segment Profile
node. A segment is a cluster number derived analytically using SAS
Text Miner clustering techniques. The Segment Profile node enables
you to get a better idea of what makes each segment unique or at least
different from the population. The node generates various reports
that aid in exploring and comparing the distribution of these factors
within the segments and population.
-
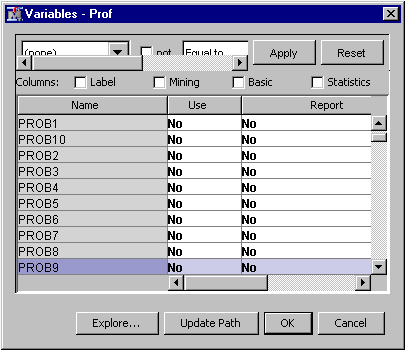
Note: You can hold down Shift and select all the PROB variables by clicking on the first PROB variable and dragging the pointer to select all PROB variables. After all PROB variables are selected, you can change the Use value of each selected PROB variable by changing the Use value of one of the PROB variables. This will change the other PROB Use values to the selected value as well.
-
Note: You can hold down Shift and select all the _SVD_ variables by clicking on the first _SVD_ variable and dragging the pointer to select all _SVD_ variables. After all _SVD_ variables are selected, you can change the Use value of each selected _SVD_ variable by changing the Use value of one of the _SVD_ variables. This will change the other _SVD_ Use values to the selected value as well.
-
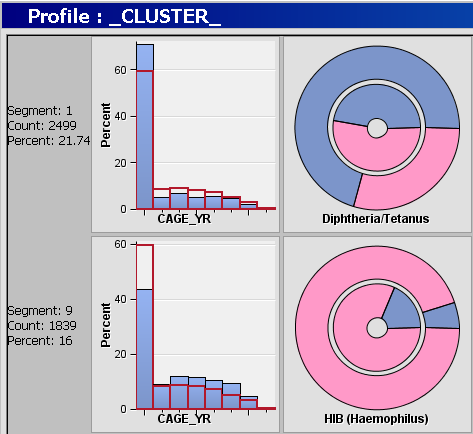
The Profile: _CLUSTER_ window displays a lattice, or grid, of plots that compare the distribution for the identified and report variables for both the segment and the population. The graphs shown in this window illustrate variables that have been identified as factors that distinguish the segment from the population it represents. Each row represents a single segment. The far-left margin identifies the segment, its count, and the percentage of the total population.The columns are organized from left to right according to their ability to discriminate that segment from the population. Report variables, if specified, appear on the right in alphabetical order after the selected inputs. The lattice graph has the following features:
-
Interval variable — displays as a histogram. The blue shaded region represents the within-segment distribution. The red outline represents the population distribution. The height of the histogram bars can be scaled by count or by percentage of the segment population. When you are using the percentage, the view shows the relative difference between the segment and the population. When you are using the count, the view shows the absolute difference between the segment and the population.