To
view interactive results, complete the following steps:
-
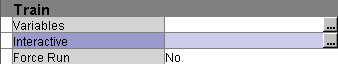
Select
the Text Miner node, and then Click the

button for the Interactive property. The Text Miner
— Interactive window opens.
-
View the terms in the
Terms window. The terms are sorted in decreasing order of frequency.
-
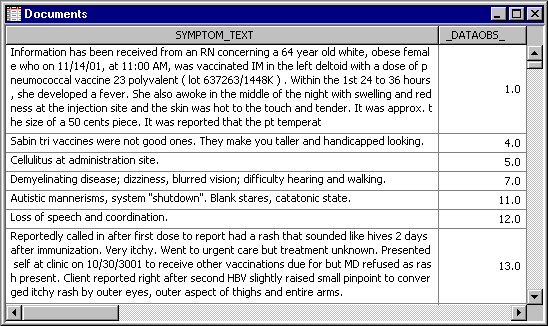
View the
documents in the Documents window. Click the Toggle Show Full Text
icon

on the toolbar to see the full text contained in
SYMPTOM_TEXT.
-
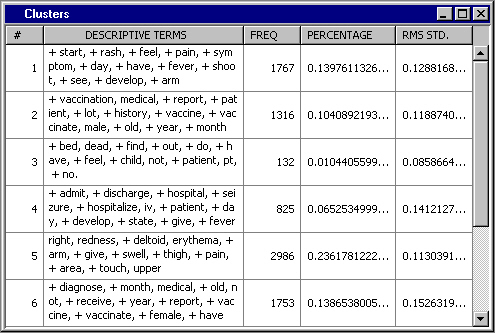
View the clusters in the Clusters
window.
-
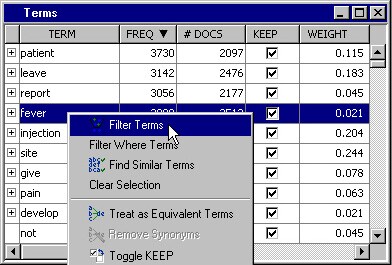
Select
a term that is related to an adverse reaction that you want to investigate
further. For example, select
fever under
the TERM column of the Terms window. Right-click on the term and select
Filter Terms.
-
Note how
the documents displayed and cluster frequencies change. Only those
documents containing
fever are displayed.
Moreover, only the documents containing
fever are counted. If the full text of the document is not shown, click
the Toggle Show Full Text icon
on the toolbar.
-
Click
the Undo icon

on the toolbar. This removes the filter that was
applied and restores the display that was shown when you opened the
Text Miner — Interactive window.
-
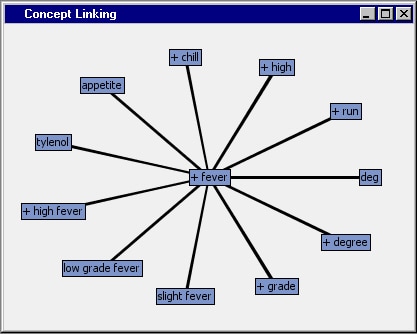
Select
fever in the Terms window, and then right-click
fever and select
View Concept Links. The Concept Linking window opens. Concept linking is a way to find
and display the terms that are highly associated with the selected
term in the Terms table. The selected term is surrounded by the terms
that correlate the strongest with it. The Concept Linking window shows
a hyperbolic tree graph with fever in the center of the tree structure.
It shows you the other terms that are strongly associated with the
term fever. To expand the Concept Linking view, right-click on any
of the terms that are not in the center of the graph and select
Expand Links.
-
Look at
the clusters in the Clusters window. Can you tell what they are about
from the descriptive terms displayed? Do some clusters look vague
or unclear?
-
Choose
one of the clusters that looks vague or unclear. This is fairly subjective,
but, for this example, you can use Cluster 2 as an example of a vague
or unclear cluster. Right-click on Cluster 2 and select
Filter Clusters. This action filters the results to
show only those documents and terms that are relevant to Cluster 2.
All the documents shown in the Documents window are contained in Cluster
2, and terms are now ordered by frequency within that cluster. Read
the text of some of the documents in this cluster. Does this clarify
the cluster better?
-
Click
the Undo icon
on the toolbar to undo any filters.
-
Close
the Text Miner — Interactive window.