| Exploring Data in Two Dimensions |
Example
In this section you create a polygon plot of the lat and lon variables of the States48 data set. The lat variable gives the latitude of state boundaries for the lower 48 contiguous United States. The lon variable gives the corresponding longitude.
| Open the States48 data set. |
| Select Graph |
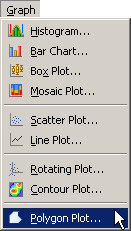
|
Figure 6.20: Selecting a Polygon Plot
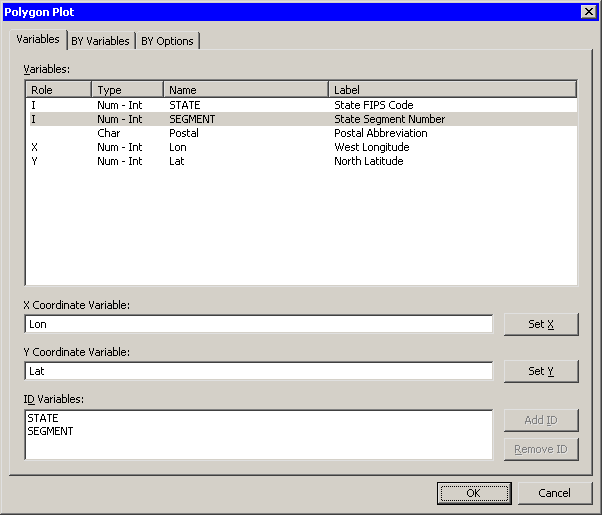
A dialog box appears as in Figure 6.21.
| Select the lon variable, and click Set X. |
| Select the lat variable, and click Set Y. |
| Select the state variable. Hold down the CTRL key and select the segment variable. Click Add ID. |
| Click OK. |
Note: The order of the ID variables is important. The second variable
should be nested in the first variable.
|
Figure 6.21: The Polygon Plot Dialog Box
A polygon plot appears (similar to Figure 6.24) showing the
contiguous 48 United States. The color of a region (in this example, a state)
is determined by the first observation encountered for that region.
The observation's fill color determines the color of the interior of the
polygon; the outline color determines the color of the region's outline.
For these data, the observations are all black. To make the polygon plot look more like a map, you can color observations by the value of the state variable.
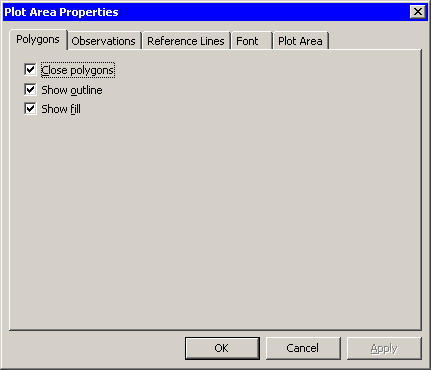
| Right-click near the center of the plot, and select Plot Area Properties from the pop-up menu. |
A dialog box appears, as shown in Figure 6.22.
|
Figure 6.22: Plot Area Properties for a Polygon Plot
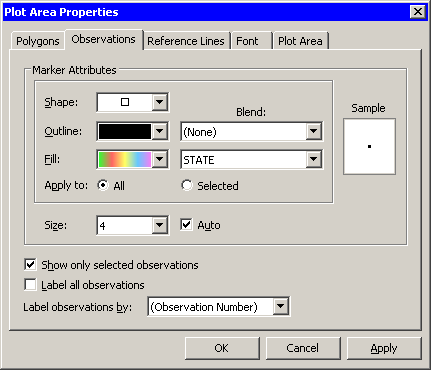
| Click the Observations tab, as shown in Figure 6.23. |
|
Figure 6.23: The Observations Tab
| Select state from the Fill: Blend menu. |
| Select a gradient colormap from the Fill menu. |
| Click OK. |
The polygon plot (Figure 6.24) is now colored according to
your choice of colormap.
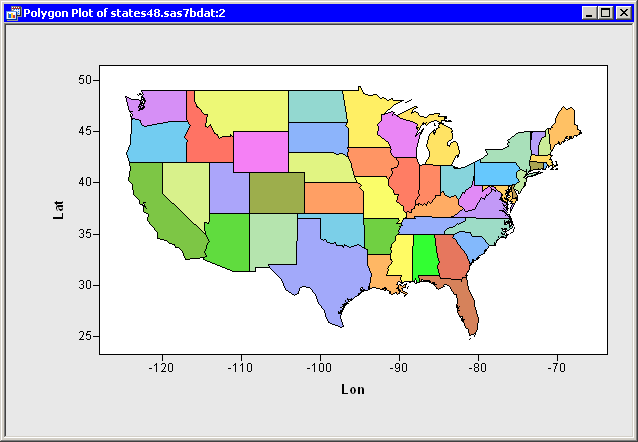
|
Figure 6.24: A Polygon Plot
The polygon plot supports the selection of polygonal regions. For example, you can
click on a state to select the
observations that define the boundary of that state. You can click
while holding down the CTRL key to select observations defining multiple
states. You can also drag out a selection rectangle to select observations
defining contiguous states.
Note that if a state is composed of two or more components, you can click on each component independently. For example, you can select just the upper peninsula of Michigan, or select only Long Island, New York. You can also color each region independently.
Copyright © 2008 by SAS Institute Inc., Cary, NC, USA. All rights reserved.