| General Plot Properties |
Context Areas
Right-clicking inside a plot window brings up a context menu. This means that the contents of the pop-up menu depend on the location of the mouse pointer when you right-click.
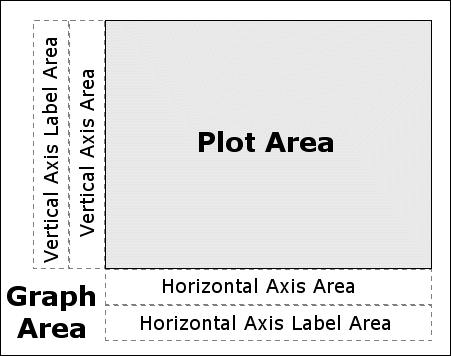
Figure 9.1 shows
six nonoverlapping regions in a plot: the plot area, the graph
area, two axis areas, and two axis label areas.
Each region has its
own context menu. The figure applies to all plots except for the
rotating plot, which lacks the "axis area" regions. The
rotating plot behaves differently because the position of the axes
changes as the plot rotates.
|
Figure 9.1: Context Areas for a Two-Dimensional Plot
The dialog box for the plot area has controls that
affect the appearance of the plot. Which tabs the dialog box displays
depends on the plot type (histogram, scatter
plot, box plot, etc.). Properties common to all plots are discussed in
this chapter. Plot-specific properties are discussed in
Chapter 5, "Exploring Data in One Dimension,"
Chapter 6, "Exploring Data in Two Dimensions,"
Chapter 7, "Exploring Data in Three Dimensions," and
Chapter 8, "Interacting with Plots."
By using the dialog box for the graph area, you can change general properties that affect the way the plot appears. This dialog box is discussed in the section "Common Graph Area Properties".
Finally, the dialog box for an axis has controls that affect the scale, font, and placement of tick marks for that axis. The dialog box for an axis label has controls that affect the font and text used to label that axis. These dialog boxes are discussed in Chapter 10, "Axis Properties."
Copyright © 2008 by SAS Institute Inc., Cary, NC, USA. All rights reserved.