| Exploring Data in One Dimension |
Example
In this section you create a box plot of the latitude variable of the Hurricanes data set, grouped by levels of the category variable. The latitude variable gives the latitude of the center of each tropical cyclone observation. The category variable gives the Saffir-Simpson wind intensity category for each observation.
The category variable also has missing values, representing weak intensities (wind speed less than 22 knots).
| Open the Hurricanes data set. |
| Select Graph |
|
Figure 5.15: Selecting a Box Plot
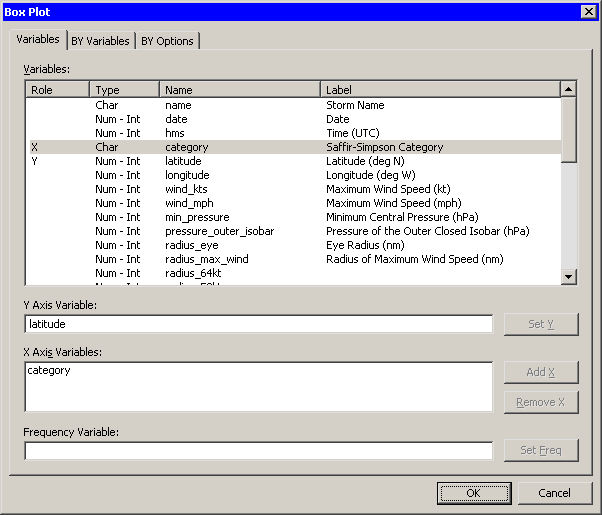
A dialog box appears as in Figure 5.16.
| Select the latitude variable, and click Set Y. |
| Select the category variable, and click Add X. |
| Click OK. |
Note: X variables are optional. If you do not select an X variable, you get a box plot of the Y variable. Only nominal variables can be selected as an X variable.
Note: The box plot also supports an optional frequency variable.
|
Figure 5.16: The Box Plot Dialog Box
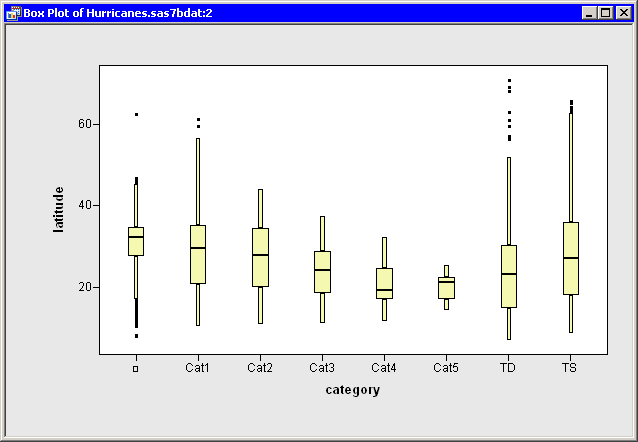
A box plot appears (Figure 5.17), showing the distribution of the latitude variable
for each unique value of the category
variable. The plot shows that the most intense cyclones occur in a
relatively narrow band of southern latitudes. Intense hurricanes
have median latitudes that are farther south than weaker
hurricanes. There is also less variance in the latitudes of the
intense hurricanes. Tropical storms and tropical depressions do not obey these
general trends, and have the largest spread in latitude.
|
Figure 5.17: A Box Plot
The category variable has missing values.
The set of missing values are grouped together and represented by a bar labeled
with the ![]() symbol.
symbol.
You can click on any box, whisker, or outlier to select the observations contained in that box. You can click while holding down the CTRL key to select observations in multiple boxes. You can drag out a selection rectangles to select observations in adjacent boxes.
Copyright © 2008 by SAS Institute Inc., Cary, NC, USA. All rights reserved.