| Multivariate Analysis: Correlation Analysis |
The Tables Tab
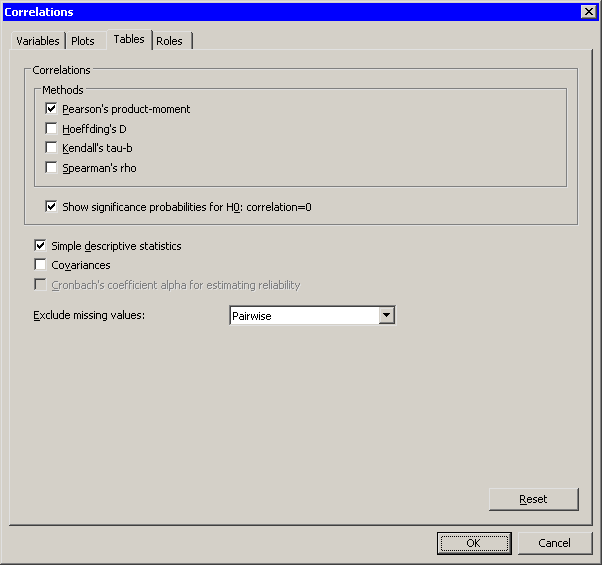
The Tables tab is shown in Figure 25.8. You can use the Tables tab to display the following tables that summarize the results of the analysis:
- Pearson's product-moment
- displays a table of Pearson correlation coefficients. Selecting this field corresponds to the PEARSON option in the PROC CORR statement. Clearing this field corresponds to the NOCORR option in the PROC CORR statement.
- Hoeffding's D
-
displays a table of Hoeffding's
 statistic. This statistic is not
available if you specify variables in the Partial list on the
Variables tab.
This corresponds to the HOEFFDING option in the PROC CORR statement.
statistic. This statistic is not
available if you specify variables in the Partial list on the
Variables tab.
This corresponds to the HOEFFDING option in the PROC CORR statement.
- Kendall's tau-b
- displays a table of Kendall's tau-b statistic. This corresponds to the KENDALL option in the PROC CORR statement.
- Spearman's rho
- displays a table of Spearman's rank-order correlation. This corresponds to the SPEARMAN option in the PROC CORR statement.
- Show significance probabilities for H0: correlation=0
-
displays
 -values under the null hypothesis of zero correlation.
Clearing this field corresponds to the NOPROB option in the PROC CORR statement.
-values under the null hypothesis of zero correlation.
Clearing this field corresponds to the NOPROB option in the PROC CORR statement.
- Simple descriptive statistics
- displays descriptive statistics for the variables in the analysis. Clearing this field corresponds to the NOSIMPLE option in the PROC CORR statement.
- Covariances
- displays the covariance matrix for the variables in the analysis. This corresponds to the COV option in the PROC CORR statement.
- Cronbach's coefficient alpha for estimating reliability
- displays Cronbach's coefficient alpha for the variables in the analysis. This corresponds to the ALPHA option in the PROC CORR statement. This statistic is not available if you specify variables in the X Variables (With) list on the Variables tab. This statistic is not available unless you select Listwise for Exclude missing values.
- Exclude missing values
- specifies how to treat missing values in the analysis. If you select Listwise, then observations with missing values are excluded from the analysis. This corresponds to the NOMISS option in the PROC CORR statement. Otherwise, statistics are computed using all of the nonmissing pairs of variables.
|
Figure 25.8: The Tables Tab
Copyright © 2008 by SAS Institute Inc., Cary, NC, USA. All rights reserved.