| Introduction |
Comparison with SAS/INSIGHT
Stat Studio and SAS/INSIGHT have the same goal: to be a tool for data exploration and analysis. Both have dynamically linked statistical graphics. Both come with pre-written statistical analyses for analyzing distributions, regression models, and multivariate relationships.
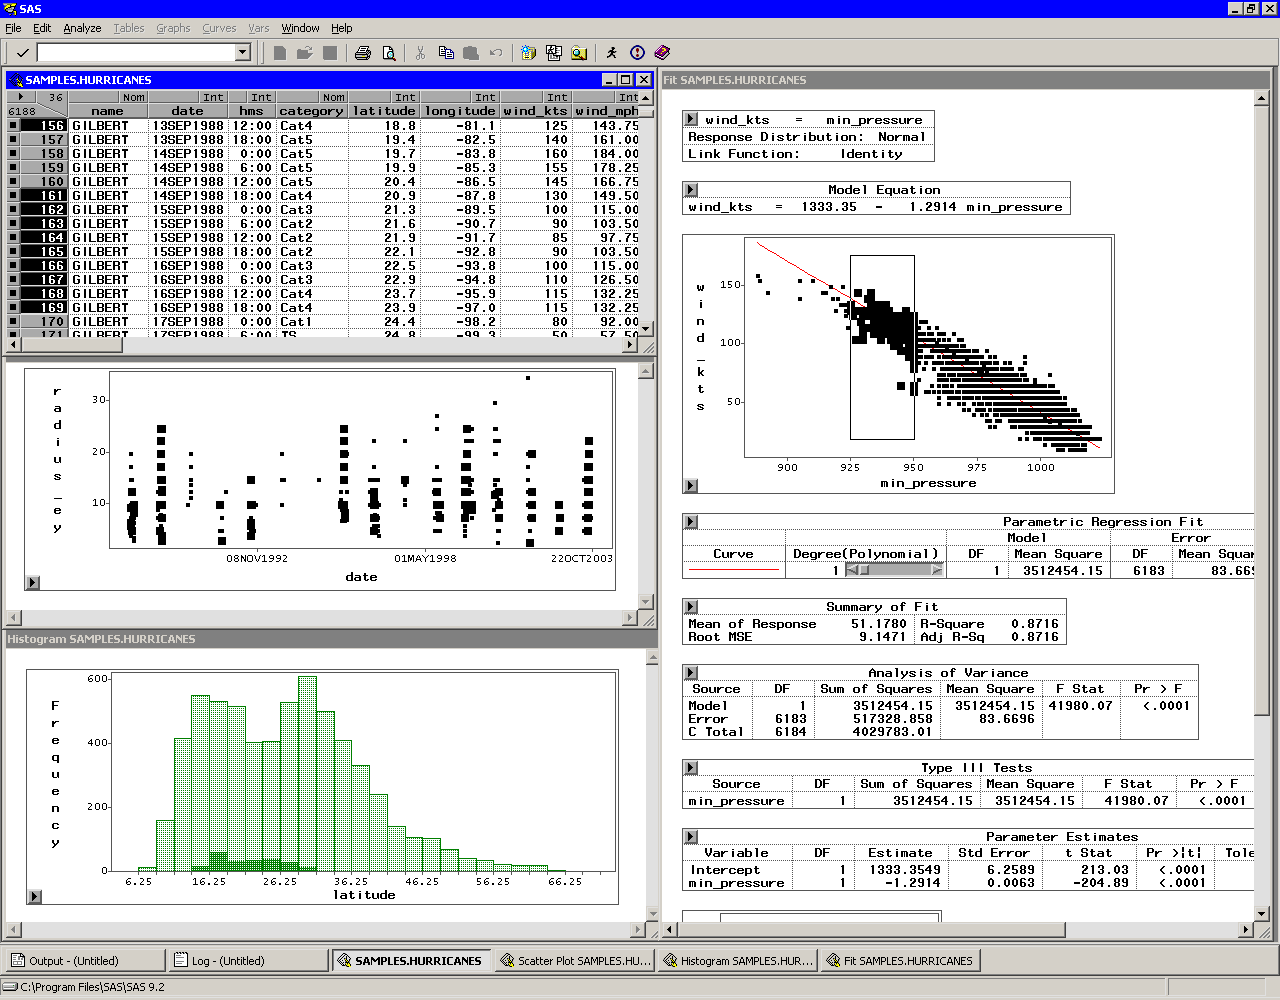
Figure 1.2 shows a typical SAS/INSIGHT
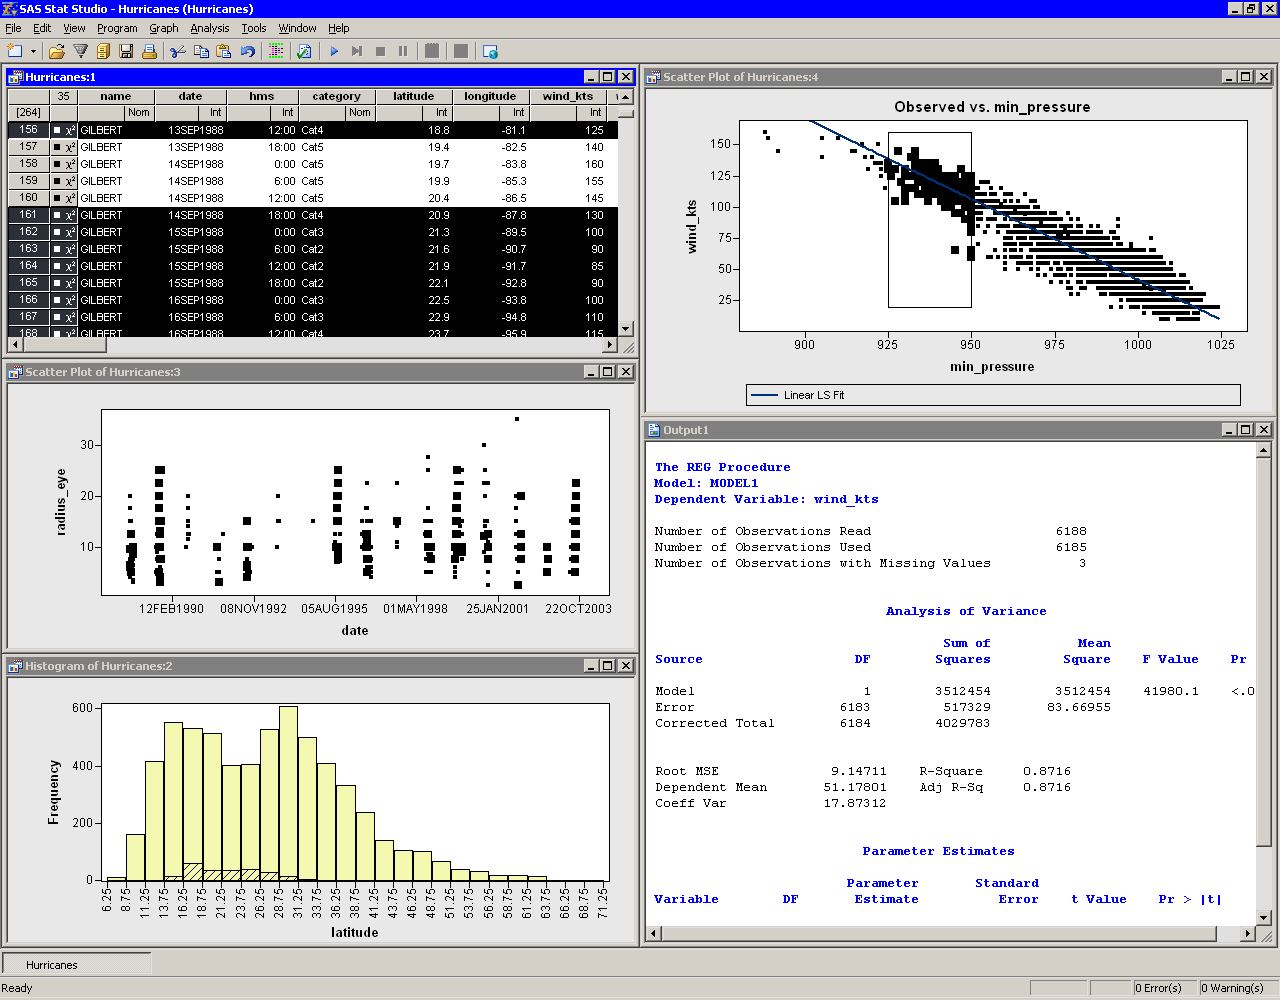
analysis. Figure 1.3 shows the same analysis
performed in Stat Studio. You can see that the analyses are
qualitatively similar.
|
Figure 1.2: A SAS/INSIGHT Analysis
|
Figure 1.3: A Comparable Stat Studio Analysis
However, there are three major differences between the two
products. The first is that Stat Studio runs on a PC in the Microsoft
Windows operating environment. It is client software that can
connect to SAS servers. The SAS server might be running on a different
computer than Stat Studio.
In contrast,
SAS/INSIGHT runs on the same computer on which SAS is installed.
A second major difference is that Stat Studio is programmable, and therefore extensible. SAS/INSIGHT contains standard statistical analyses that are commonly used in data analysis, but you cannot create new analyses. In contrast, you can write programs in Stat Studio that call any licensed SAS procedure, and you can include the results of that procedure in graphics, tables, and data sets. Because of this, Stat Studio is often referred to as the "programmable successor to SAS/INSIGHT."
A third major difference is that the Stat Studio statistical graphics are programmable. You can add legends, curves, and other features to the graphics in order to better analyze and visualize your data.
Stat Studio contains many features that are not available in SAS/INSIGHT. General features that are unique to Stat Studio include the following:
- Stat Studio can connect to multiple SAS servers simultaneously.
- Stat Studio can run multiple programs simultaneously in different threads, each with its own WORK library.
- Stat Studio sessions can be driven by a program and rerun.
The following list presents features of Stat Studio data views (tables and plots) that are not included in SAS/INSIGHT:
- Stat Studio provides modern dialog boxes with a native Windows look and feel.
- Stat Studio provides a line plot in which the lines can be defined by specifying a single X and Y variable and one or more grouping variables.
- Stat Studio supports a polygon plot that can be used to build interactive regions such as maps.
- Stat Studio provides programmatic methods to draw legends, curves, or other decorations on any plot.
- Stat Studio provides programmatic methods to attach a menu to any plot. After the menu is selected, a user-specified program is run.
- Stat Studio supports arbitrary unions and intersections of observations selected in different views.
Stat Studio also provides the following analyses and options that are not included in SAS/INSIGHT:
- Stat Studio can be programmed to call any licensed SAS analytical procedure and any IML function or subroutine.
- Stat Studio detects outliers in contaminated Gaussian data.
- Stat Studio fits robust regression models and detects outliers and high-leverage observations.
- Stat Studio supports the generalized linear model with a multinomial response.
- Stat Studio creates graphical results for the analysis of logistic models with one continuous effect and a small number of levels for classification effects.
- Stat Studio provides parametric and nonparametric methods of discriminant analysis.
- Stat Studio provides common factor analysis for interval variables.
- Stat Studio provides correspondence analysis for nominal variables.
Features of SAS/INSIGHT that are not included in Stat Studio are presented in Appendix B, "SAS/INSIGHT Features Not Available in Stat Studio."
Copyright © 2008 by SAS Institute Inc., Cary, NC, USA. All rights reserved.